-
Back to menu
Prices
-
Back to menu
-
Back to menu
Indices -
Back to menu
Research
-
Back to menu
Events -
Back to menu
Sponsored
-
Back to menu
Videos -
Back to menu
-
Back to menu
-
Back to menu
Webinars
Select Language
By Omkar Godbole|Edited by Sheldon Reback
Sep 10, 2025, 2:02 p.m.

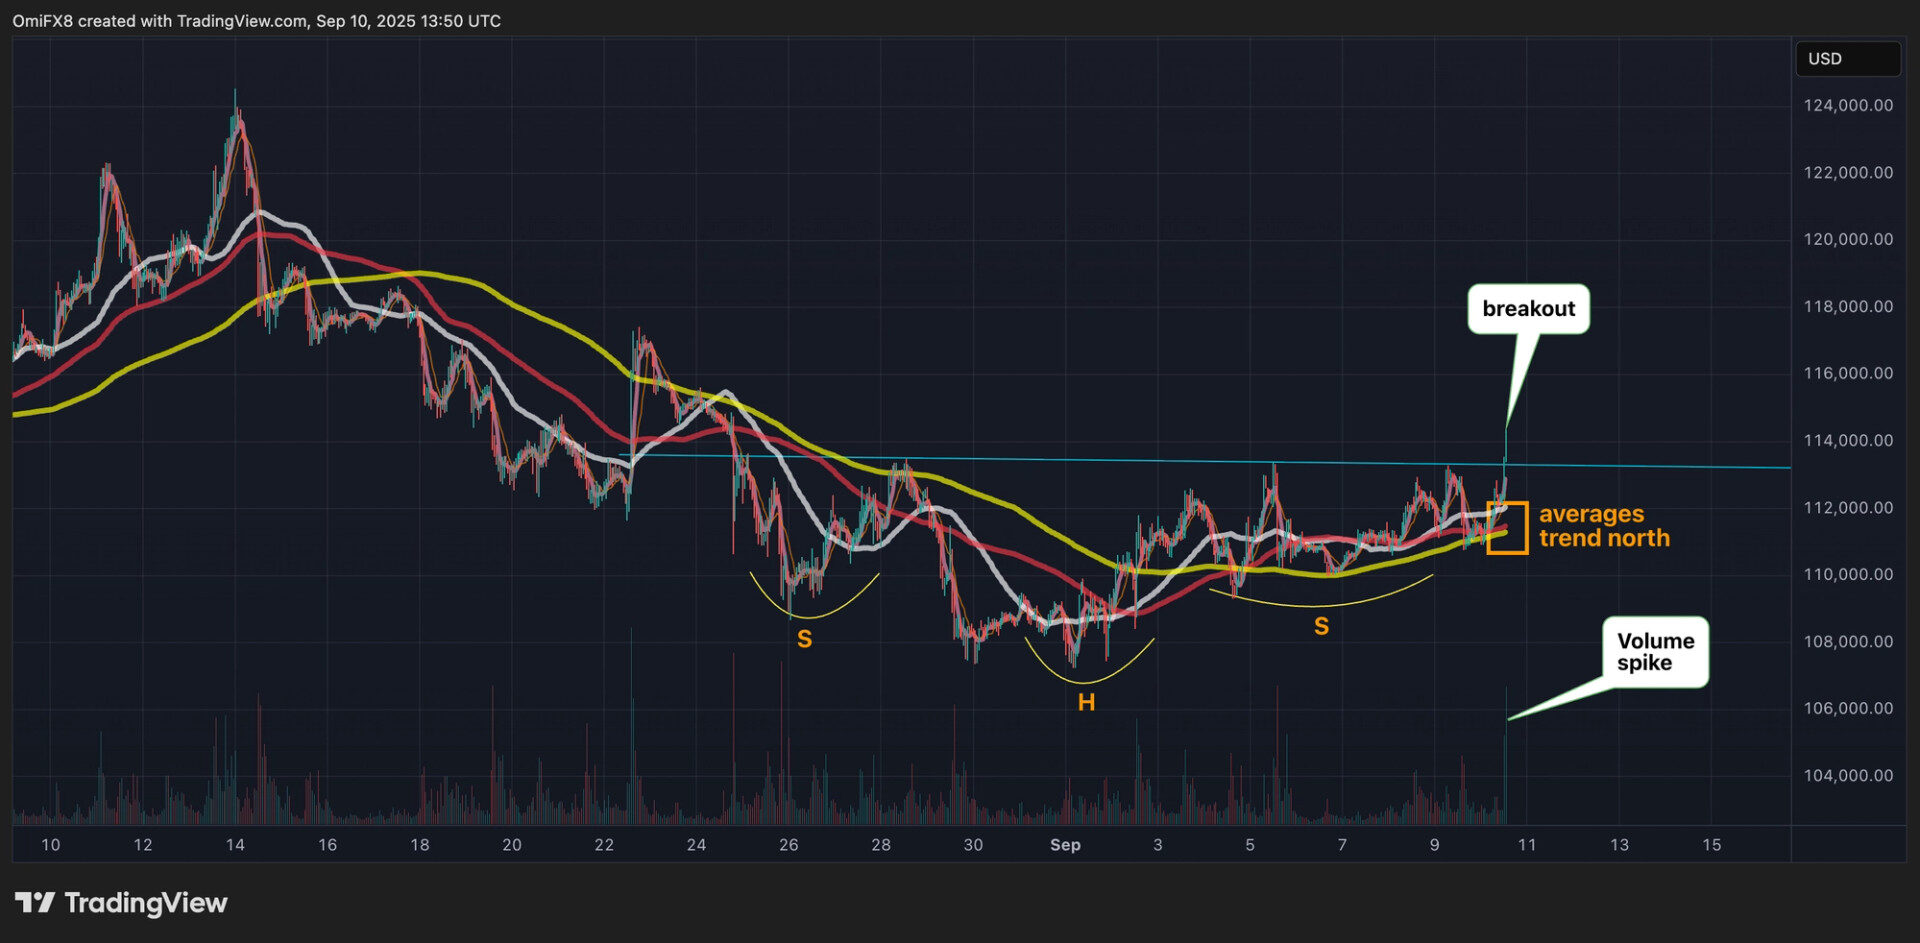
- Bitcoin surged past $113,600, confirming a bullish inverse head and shoulders pattern.
- Bulls may face resistance at the 50-day SMA of $114,700, while $110,000 serves as a key level to beat for the bears.
This is a daily analysis by CoinDesk analyst and Chartered Market Technician Omkar Godbole.
A softer-than-expected U.S. PPI pushed bitcoin BTC$114,116.11 past $113,600, confirming the bullish inverse head and shoulders pattern highlighted earlier this week.
STORY CONTINUES BELOW
The breakout signals the end of the recent pullback from record highs above $124,000 and the resumption of the broader rally. Using the measured move technique, which adds the distance between the pattern’s low and the breakout point to the breakout level, suggests bitcoin could reach nearly $120,000.
The ascending 50-, 100-, and 200-hour simple moving averages (SMAs) support the bullish momentum gathering strength. Additionally, the daily chart’s MACD histogram crossing above zero further confirms a positive shift in market sentiment.
On the upside, bulls may encounter resistance near the heavily watched 50-day SMA at $114,700, while on the downside, the recent higher low at around $110,000 serves as a key level for bears to challenge.

More For You
By Krisztian Sandor, Stephen Alpher|Edited by Stephen Alpher
43 minutes ago

Traders boosted bets that the Fed would cut rates by 50 basis points next week, but bitcoin bulls have plenty of reason for caution.
What to know:
- Soft wholesale inflation data pushed crypto prices higher early Wednesday.
- Whether gains can hold remains in question as prices recently have not reacted positively to a run of bullish news.
- Consumer inflation numbers will be released tomorrow.


