-
Back to menu
Prices
-
Back to menu
-
Back to menu
Indices -
Back to menu
Research
-
Back to menu
Events -
Back to menu
Sponsored
-
Back to menu
Videos -
Back to menu
-
Back to menu
-
Back to menu
Webinars
Select Language
Corporate treasury departments and institutional funds drive unprecedented trading volumes amid regulatory uncertainty.
By CD Analytics, Oliver Knight
Updated Sep 15, 2025, 4:15 p.m. Published Sep 15, 2025, 4:15 p.m.

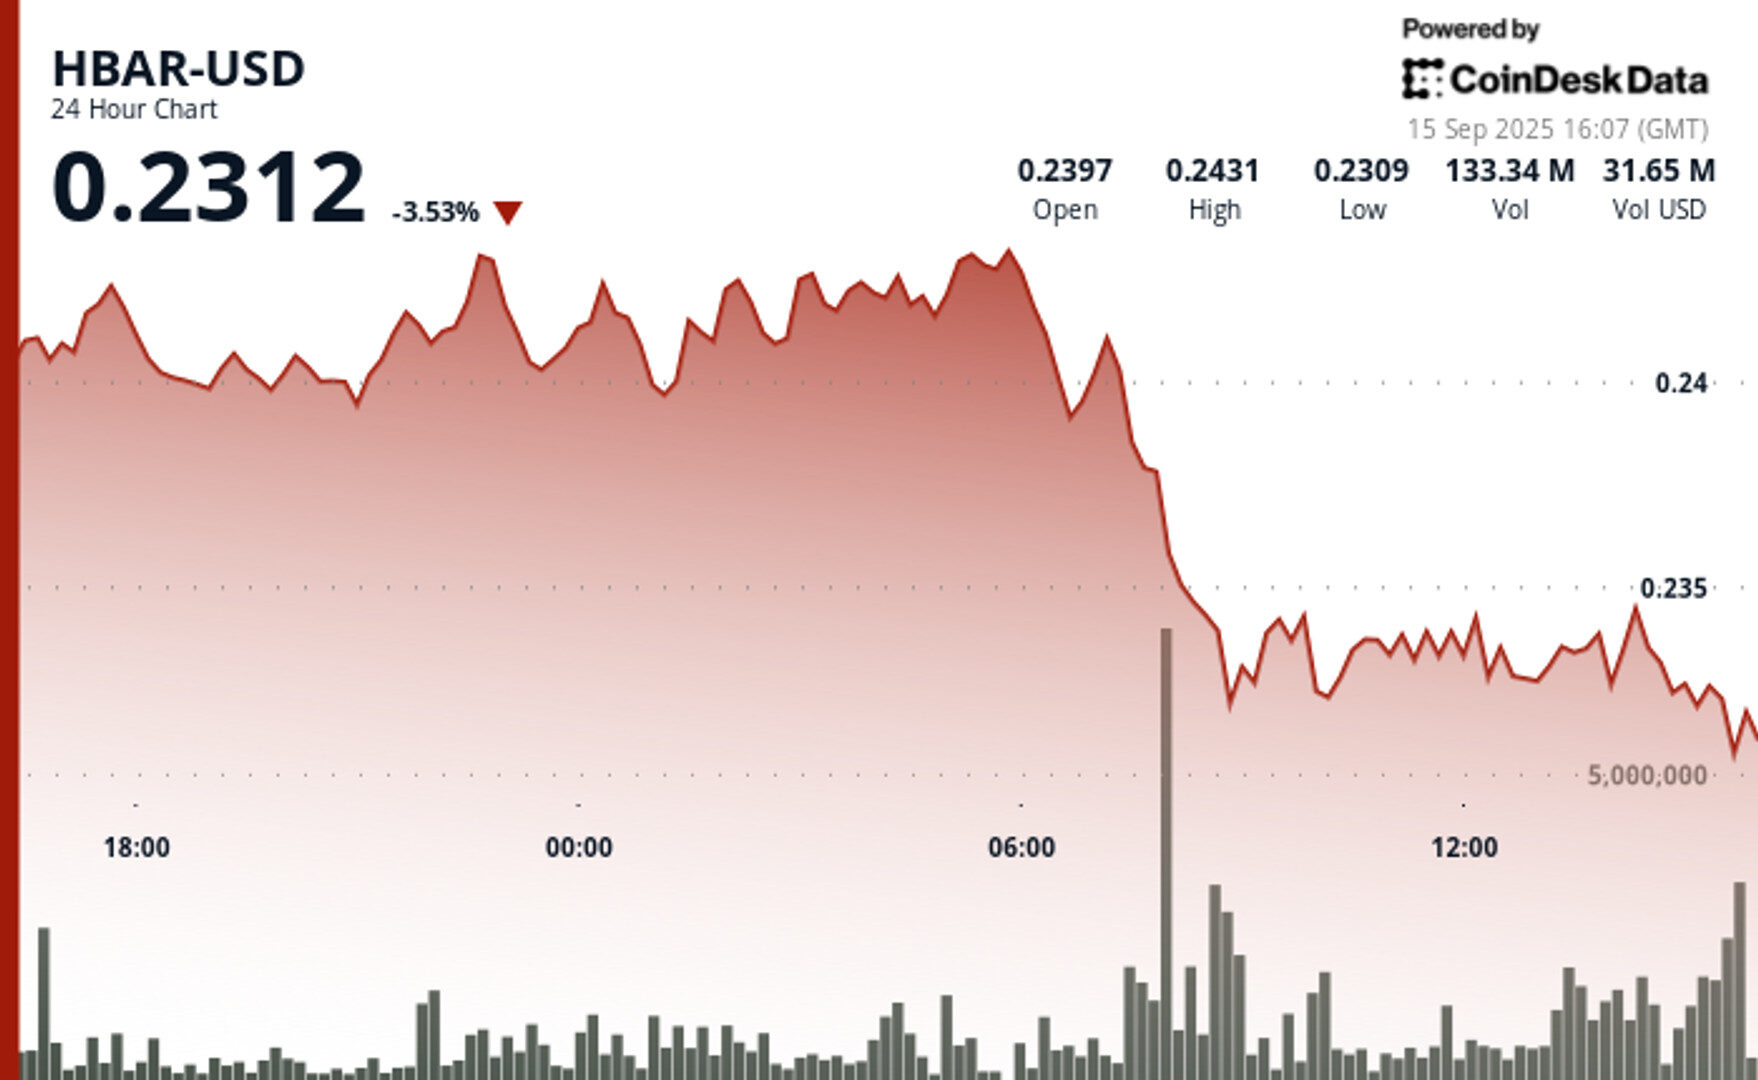
- HBAR slid 5% between Sept. 14–15, dropping from $0.24 to $0.23 amid concentrated corporate selling.
- Institutional volumes spiked to 126.38 million tokens on Sept. 15, nearly triple typical activity, signaling large-scale portfolio rebalancing.
- Recovery attempts faltered, with buyers testing $0.24 resistance before retreating, leaving $0.23 as the key support level.
Hedera Hashgraph’s HBAR token endured steep losses over a volatile 24-hour window between September 14 and 15, falling 5% from $0.24 to $0.23. The token’s trading range expanded by $0.01 — a move often linked to outsized institutional activity — as heavy corporate selling overwhelmed support levels. The sharpest move came between 07:00 and 08:00 UTC on September 15, when concentrated liquidation drove prices lower after days of resistance around $0.24.
Institutional trading volumes surged during the session, with more than 126 million tokens changing hands on the morning of September 15 — nearly three times the norm for corporate flows. Market participants attributed the spike to portfolio rebalancing by large stakeholders, with enterprise adoption jitters and mounting regulatory scrutiny providing the backdrop for the selloff.
STORY CONTINUES BELOW
Recovery efforts briefly emerged during the final hour of trading, when corporate buyers tested the $0.24 level before retreating. Between 13:32 and 13:35 UTC, one accumulation push saw 2.47 million tokens deployed in an effort to establish a price floor. Still, buying momentum ultimately faltered, with HBAR settling back into support at $0.23.
The turbulence underscores the token’s vulnerability to institutional distribution events. Analysts point to the failed breakout above $0.24 as confirmation of fresh resistance, with $0.23 now serving as the critical support zone. The surge in volume suggests major corporate participants are repositioning ahead of regulatory shifts, leaving HBAR’s near-term outlook dependent on whether enterprise buyers can mount sustained defenses above key support.

- Corporate resistance levels crystallized at $0.24 where institutional selling pressure consistently overwhelmed enterprise buying interest across multiple trading sessions.
- Institutional support structures emerged around $0.23 levels where corporate buying programs have systematically absorbed selling pressure from retail and smaller institutional participants.
- The unprecedented trading volume surge to 126.38 million tokens during the 08:00 morning session reflects enterprise-scale distribution strategies that overwhelmed corporate demand across major trading platforms.
- Subsequent institutional momentum proved unsustainable as systematic selling pressure resumed between 13:37-13:44, driving corporate participants back toward $0.23 support zones with sustained volumes exceeding 1 million tokens, indicating ongoing institutional distribution.
- Final trading periods exhibited diminishing corporate activity with zero recorded volume between 13:13-14:14, suggesting institutional participants adopted defensive positioning strategies as HBAR consolidated at $0.23 amid enterprise uncertainty.
Disclaimer: Parts of this article were generated with the assistance from AI tools and reviewed by our editorial team to ensure accuracy and adherence to our standards. For more information, see CoinDesk’s full AI Policy.
More For You
By CD Analytics, Oliver Knight
2 hours ago

Stellar’s XLM token slid 3% amid institutional selling, but intraday volatility showed signs of short-lived recovery.
What to know:
- XLM fell from $0.39 to $0.38 over 24 hours, with liquidation pushing volume above 101 million, nearly triple average levels.
- The $0.395 level emerged as firm resistance, while $0.375 attracted buying interest during heavy selloffs.


