Hedera’s native token slid 3.6% over 23 hours, with heavy institutional selling pushing prices below key support levels ahead of a potential SEC ETF decision.
By CD Analytics, Oliver Knight
Updated Oct 3, 2025, 4:18 p.m. Published Oct 3, 2025, 4:18 p.m.

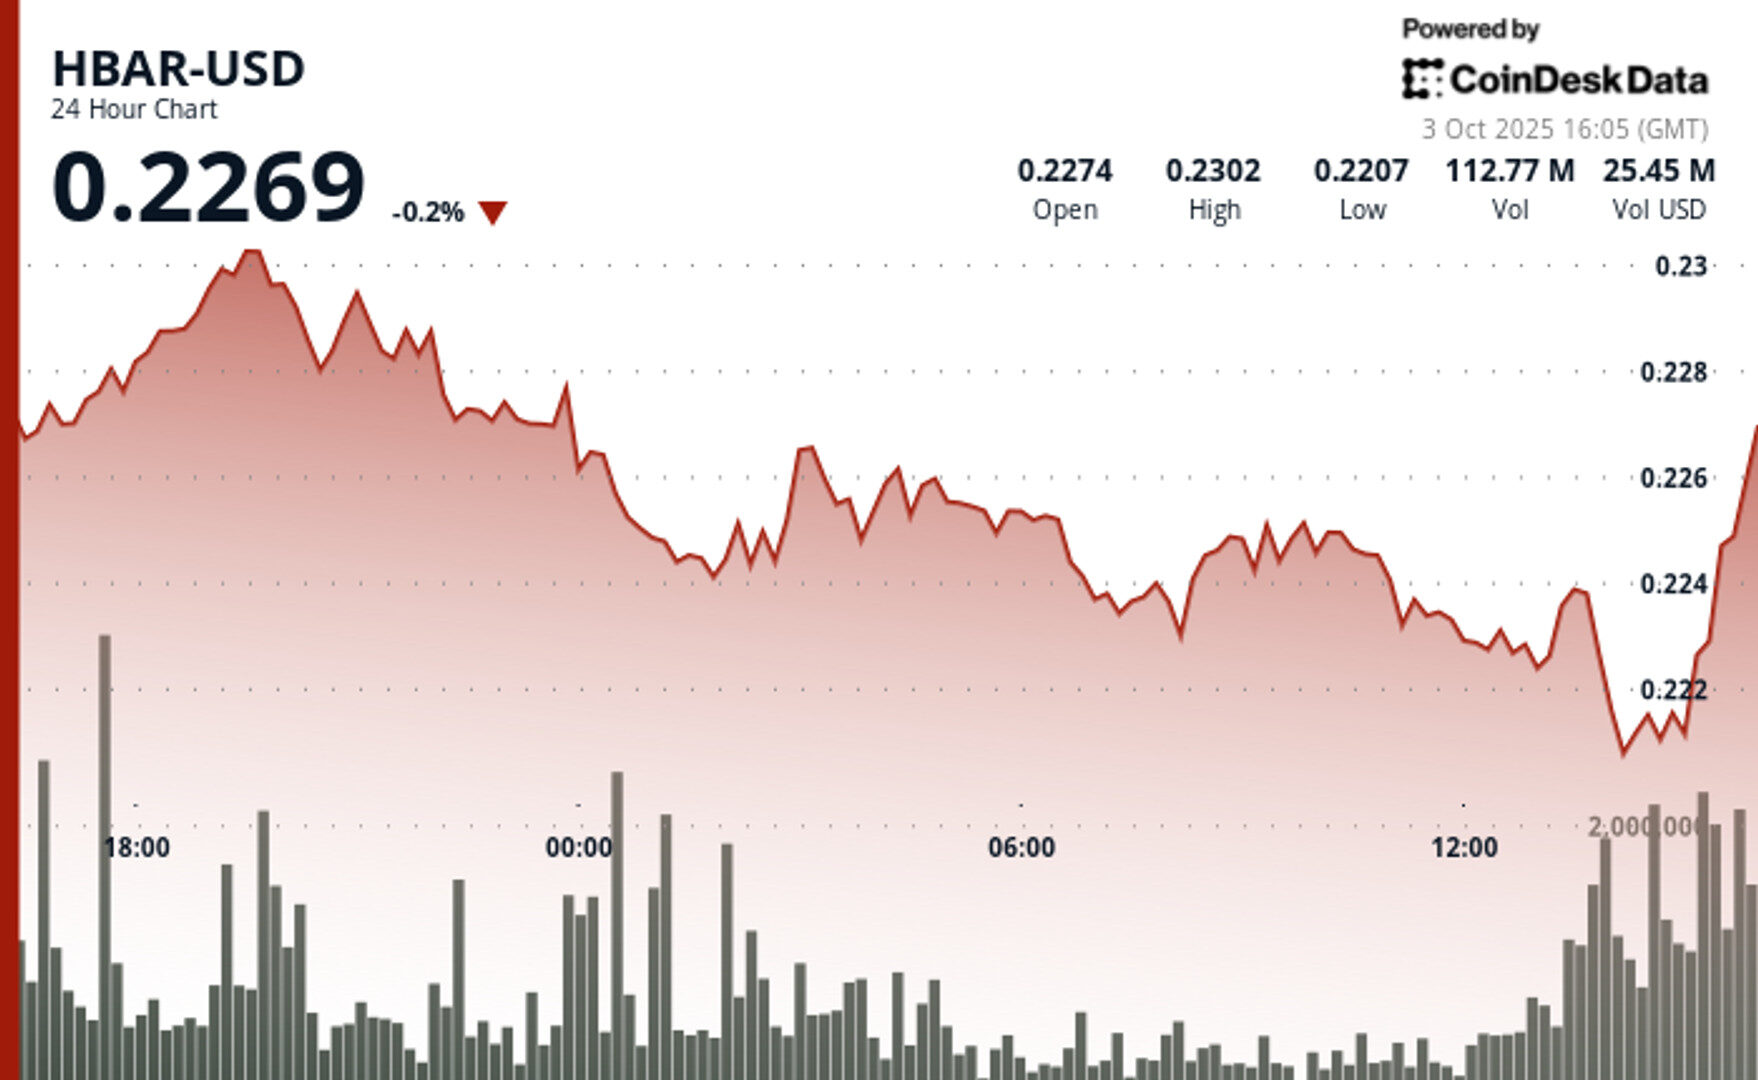
- HBAR fell from $0.23 to $0.22 between Oct. 2–3, with the steepest drop in the final hour of trading on Oct. 3.
- Volume spikes above 3 million during the 13:50–14:00 window signaled distribution and fear-driven selling.
- Despite technical weakness, HBAR could see renewed momentum if the SEC approves spot crypto ETFs in November.
HBAR saw sharp selling pressure on Oct. 3, with momentum intensifying in the final hour of trading. After briefly reaching $0.224, the token fell to $0.222, breaching key support and ending the session down 0.9%.
The steepest drop came between 13:50 and 14:00, when volumes spiked above 3 million, signaling institutional distribution and panic-driven selling. Repeated failures to reclaim $0.224 leave HBAR vulnerable to further downside toward $0.220.
STORY CONTINUES BELOW
Across the broader 23-hour period from October 2 to 3, HBAR dropped 3.6% from $0.23 to $0.22 on surging volume of 51.3 million, underscoring heavy institutional participation in the selloff.
Despite near-term weakness, attention remains on a potential SEC decision in November on spot crypto ETFs. With backing from governing council members like Google and IBM, Hedera could benefit from regulatory approval even as its technicals point to ongoing pressure.

Technical Metrics Indicate Ongoing Weakness
- HBAR formed a distinct downward trajectory following its peak at $0.23 on 2 October 19:00, with resistance developing at the $0.23 threshold where prices repeatedly reversed lower during multiple trading sessions.
- Essential support developed at $0.23 around midnight on 3 October, followed by an additional support area near $0.22, although both thresholds demonstrated vulnerability under continuous selling momentum.
- Trading volume characteristics revealed elevated activity throughout the initial decline and subsequently during the 13:00 session on 3 October with 51.3 million in volume, indicating institutional engagement in the bearish movement.
- Technical deterioration intensified during the final hour as HBAR struggled to maintain recovery efforts above $0.22 resistance threshold, validating the breach of essential support thresholds.
- Substantial volume surges exceeding 3 million and 2.5 million during the 13:50-14:00 window coincided with intense selling activity, demonstrating institutional distribution and fear-driven selling.
Disclaimer: Parts of this article were generated with the assistance from AI tools and reviewed by our editorial team to ensure accuracy and adherence to our standards. For more information, see CoinDesk’s full AI Policy.
More For You
Sep 9, 2025
Combined spot and derivatives trading on centralized exchanges surged 7.58% to $9.72 trillion in August, marking the highest monthly volume of 2025
What to know:
- Combined spot and derivatives trading on centralized exchanges surged 7.58% to $9.72 trillion in August, marking the highest monthly volume of 2025
- Gate exchange emerged as major player with 98.9% volume surge to $746 billion, overtaking Bitget to become fourth-largest platform
- Open interest across centralized derivatives exchanges rose 4.92% to $187 billion
More For You
By CD Analytics, Oliver Knight
25 minutes ago

XLM briefly pushed higher on Oct. 3 before sharp selling erased gains, highlighting resistance near $0.41 even as Bitcoin.com Wallet integration expands Stellar’s reach.
What to know:
- XLM climbed to $0.4041 before sliding back to $0.4015 on heavy sell pressure after 14:00 UTC.
- More than 1.4M tokens traded in one minute, validating resistance at the $0.41 level.
- Bitcoin.com Wallet integration broadens access to Stellar’s ecosystem, while October’s seasonality has historically supported crypto prices.


