HBAR Slides 1.7% to $0.170 as Channel Support Crumbles
Hedera’s token faces selling pressure after a failed breakout near $0.1716, with technical patterns signaling potential institutional distribution.
By CD Analytics, Oliver Knight
Updated Oct 24, 2025, 3:54 p.m. Published Oct 24, 2025, 3:54 p.m.

- Trading volume jumped 87% above its 24-hour average as HBAR failed to sustain gains above $0.1716 resistance.
- The token’s ascending support near $0.170 collapsed after a sharp afternoon selloff, confirming short-term bearish bias.
- Repeated failed rebounds and declining highs point to potential distribution rather than a temporary correction.
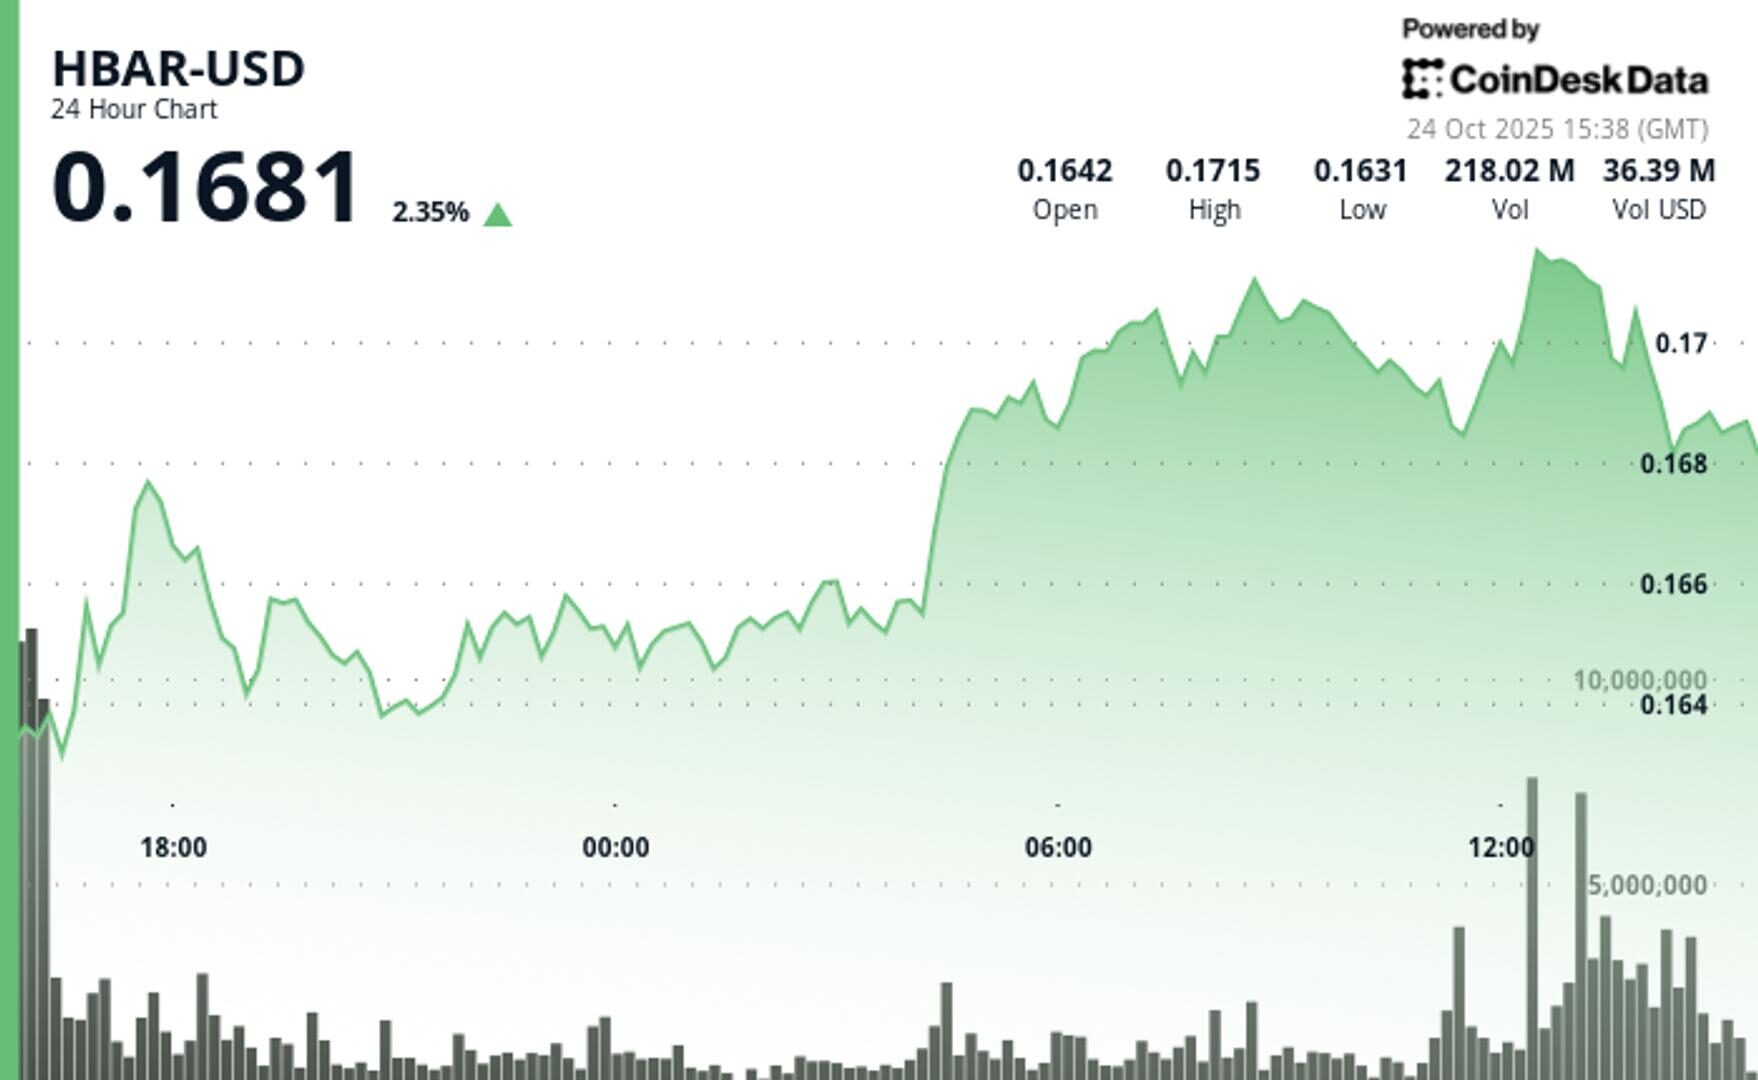
Hedera’s HBAR token slipped 1.7% over the past 24 hours, retreating from $0.1669 to $0.1697 after a failed breakout attempt above key resistance. The move unfolded within a volatile $0.0089 range, reflecting 5.2% intraday swings as buyers struggled to maintain momentum.
Early support at the $0.1633 base held briefly before the token’s ascending trendline gave way, signaling weakening bullish structure.
STORY CONTINUES BELOW
The decisive shift came around 13:00 UTC, when trading volume surged to 109.46 million tokens—87% above the 24-hour average—coinciding with a rejection near the $0.1716 resistance level. That spike marked the start of sustained selling pressure, with a subsequent 4.72 million-token surge at 13:39 confirming a clean breakdown below $0.170 support.
Technical signals now point to a developing distribution phase rather than a short-term dip. Repeated failed rebounds, declining highs, and volume-driven breakdowns suggest institutional selling may be driving the move, contrasting with typical retail volatility patterns.
A brief three-minute trading halt between 14:14 and 14:17 UTC, during which no volume was recorded, added to uncertainty. How trading resumes around this pause will help determine whether HBAR’s bearish bias deepens or stabilizes if liquidity returns.

Support/Resistance:
- Primary resistance holds at $0.1716, following strong rejection on heavy volume.
- Ascending trendline support was broken at $0.170 during a sharp afternoon selloff.
- Base support remains at $0.1633, established from overnight session lows.
Volume Analysis:
- Peak volume surged to 109.46M tokens, which is 87% above the 58.5M SMA, confirming distribution.
- A critical breakdown volume spike to 4.72M at 13:39 validated the technical failure.
- Volume contraction into the close suggests exhausted buying pressure.
Chart Patterns:
- The ascending channel pattern failed with a rejected breakout attempt above $0.171.
- Multiple higher lows from the $0.1633 base were invalidated by the trendline violation.
- Distribution characteristics emerged through declining highs and failed rebounds.
Targets & Risk/Reward:
- Immediate downside target is toward the $0.1633 support base following the breakdown.
- Risk management should remain above $0.1716 resistance for short-term bearish positioning.
- Trading halt resumption patterns are critical for confirming directional momentum.
Disclaimer: Parts of this article were generated with the assistance from AI tools and reviewed by our editorial team to ensure accuracy and adherence to our standards. For more information, see CoinDesk’s full AI Policy.
More For You

Stablecoin payment volumes have grown to $19.4B year-to-date in 2025. OwlTing aims to capture this market by developing payment infrastructure that processes transactions in seconds for fractions of a cent.
More For You
By Will Canny, AI Boost|Edited by Stephen Alpher
1 hour ago

Gemini’s trading growth is slowing despite strong card sign-ups and app downloads, said Citigroup, while Bullish momentum is accelerating.
What to know:
- Citigroup cuts its price target on neutral-rated Gemini, while lifting its outlook on buy-rated Bullish.
- Gemini’s exchange growth will take longer, with Oct. volumes lagging expectations despite strong card sign-ups and app downloads, said bank’s analyst team.
- Bullish’s New York BitLicense approval and expanding institutional access are signs of growing momentum.


-
Back to menu
Prices
-
Back to menu
-
Back to menu
Indices -
Back to menu
Research
-
Back to menu
Consensus 2026 -
Back to menu
Sponsored
-
Back to menu
Videos -
Back to menu
-
Back to menu
-
Back to menu
Webinars
Select Language