Stellar’s XLM Holds Steady at $0.2975 as Weak Volume Caps Rebound Momentum
-
News
-
Video
-
Consensus 2026
-
Data & Indices
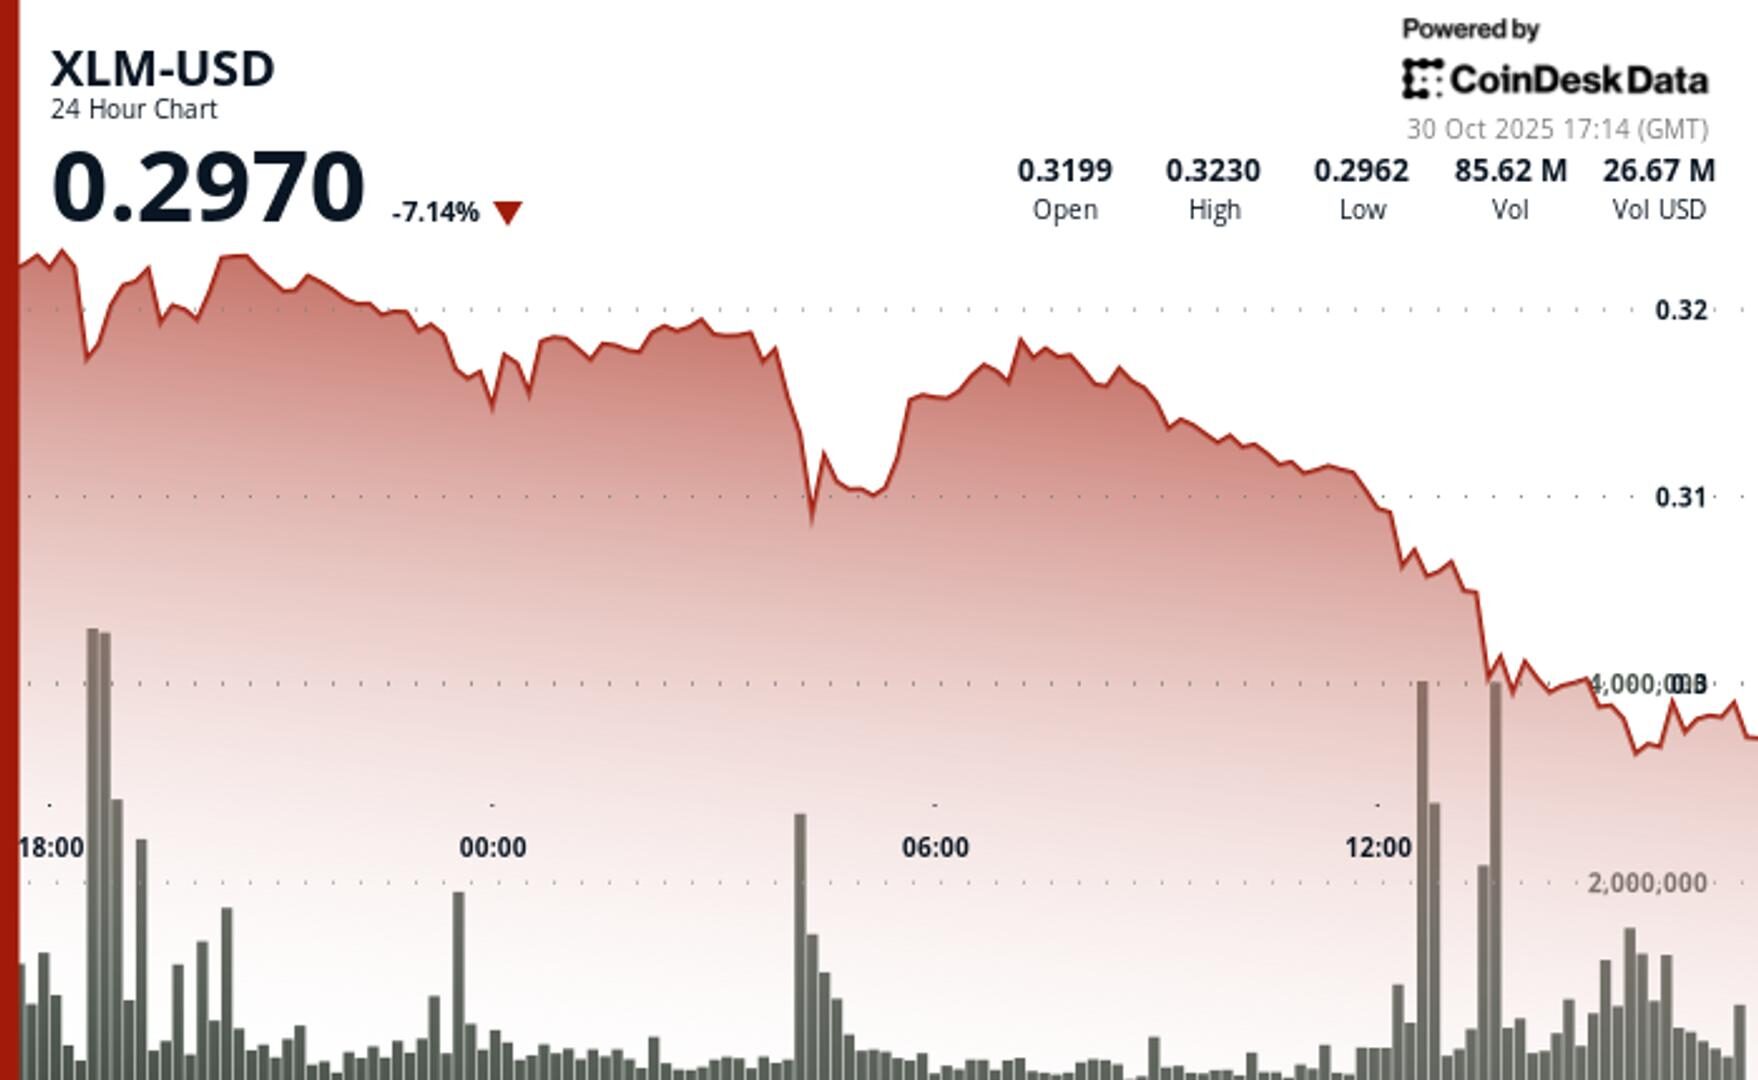
XLM consolidated near $0.2975 after a volatile session, underperforming the broader crypto market despite signs of accumulation near key support.
By CD Analytics, Oliver Knight
Updated Oct 30, 2025, 5:22 p.m. Published Oct 30, 2025, 5:22 p.m.

- XLM underperformed by 3.53%, holding at $0.2975 while broader crypto assets advanced.
- Trading volume fell 21% below the 30-day average, signaling weak conviction and a largely retail-driven move.
- Support sits at $0.2950, with resistance at $0.3000–$0.3050; a breakout requires stronger institutional participation.
Stellar’s XLM consolidated at $0.2975 on Tuesday but lagged the broader crypto market by 3.53%, highlighting weak relative strength.
Trading volume fell 21% below the 30-day average, pointing to limited conviction behind the move. Analysts said the price action appeared retail-driven, with little evidence of institutional support — a key ingredient for sustained upside.
STORY CONTINUES BELOW
XLM plunged from $0.3194 to $0.2952 before a sharp V-shaped recovery to $0.2980, hinting at possible accumulation near $0.2950 support. However, the muted volume suggests any breakout above the $0.3000–$0.3050 zone will require stronger participation from larger players.

- Support/Resistance
- Primary support holding at $0.2950.
- Resistance cluster forming at $0.3000–$0.3050, with critical resistance at $0.3200 following the earlier breakdown.
- Volume Analysis
- 81.9M volume (up 198% above the 24-hour SMA) marked the reversal point.
- Overall session volume was 21% below the 30-day average, indicating weak conviction behind the move.
- Chart Patterns
- V-shaped recovery from session lows suggests a possible double-bottom formation.
- Sustained volume confirmation is required to validate the pattern.
- Risk/Reward
- Current positioning at $0.2975 offers a favorable setup.
- Tight stops below $0.2950 support, with targets at the $0.3050 resistance zone.
Disclaimer: Parts of this article were generated with the assistance from AI tools and reviewed by our editorial team to ensure accuracy and adherence to our standards. For more information, see CoinDesk’s full AI Policy.
More For You
Oct 16, 2025

Stablecoin payment volumes have grown to $19.4B year-to-date in 2025. OwlTing aims to capture this market by developing payment infrastructure that processes transactions in seconds for fractions of a cent.
More For You
By CD Analytics, Helene Braun|Edited by Sheldon Reback
11 minutes ago

A 160% spike in trading volume and stop-loss cascades drove the plunge, with SUI stabilizing just above key support amid mounting November supply concerns.
What to know:
- SUI dropped to $2.29 after losing support at $2.41, with selling volume spiking 160% above the average.
- Traders reacted to a $146.55 million token unlock scheduled for November, triggering defensive selling.
- The decline occurred even as SUI’s Momentum DEX reached $26 billion in trading volume and Bing Gordon joined the foundation as an adviser.


-
Back to menu
Prices
-
Back to menu
-
Back to menu
Indices -
Back to menu
Research
-
Back to menu
Consensus 2026 -
Back to menu
Sponsored
-
Back to menu
Videos -
Back to menu
-
Back to menu
-
Back to menu
Webinars
Select Language