AAVE Price News: Drops 8% Amid Crypto Weakness Despite RWA DeFi Momentum
-
News
-
Video
-
Consensus 2026
-
Data & Indices
By CD Analytics, Krisztian Sandor|Edited by Nikhilesh De
Oct 30, 2025, 9:19 p.m.

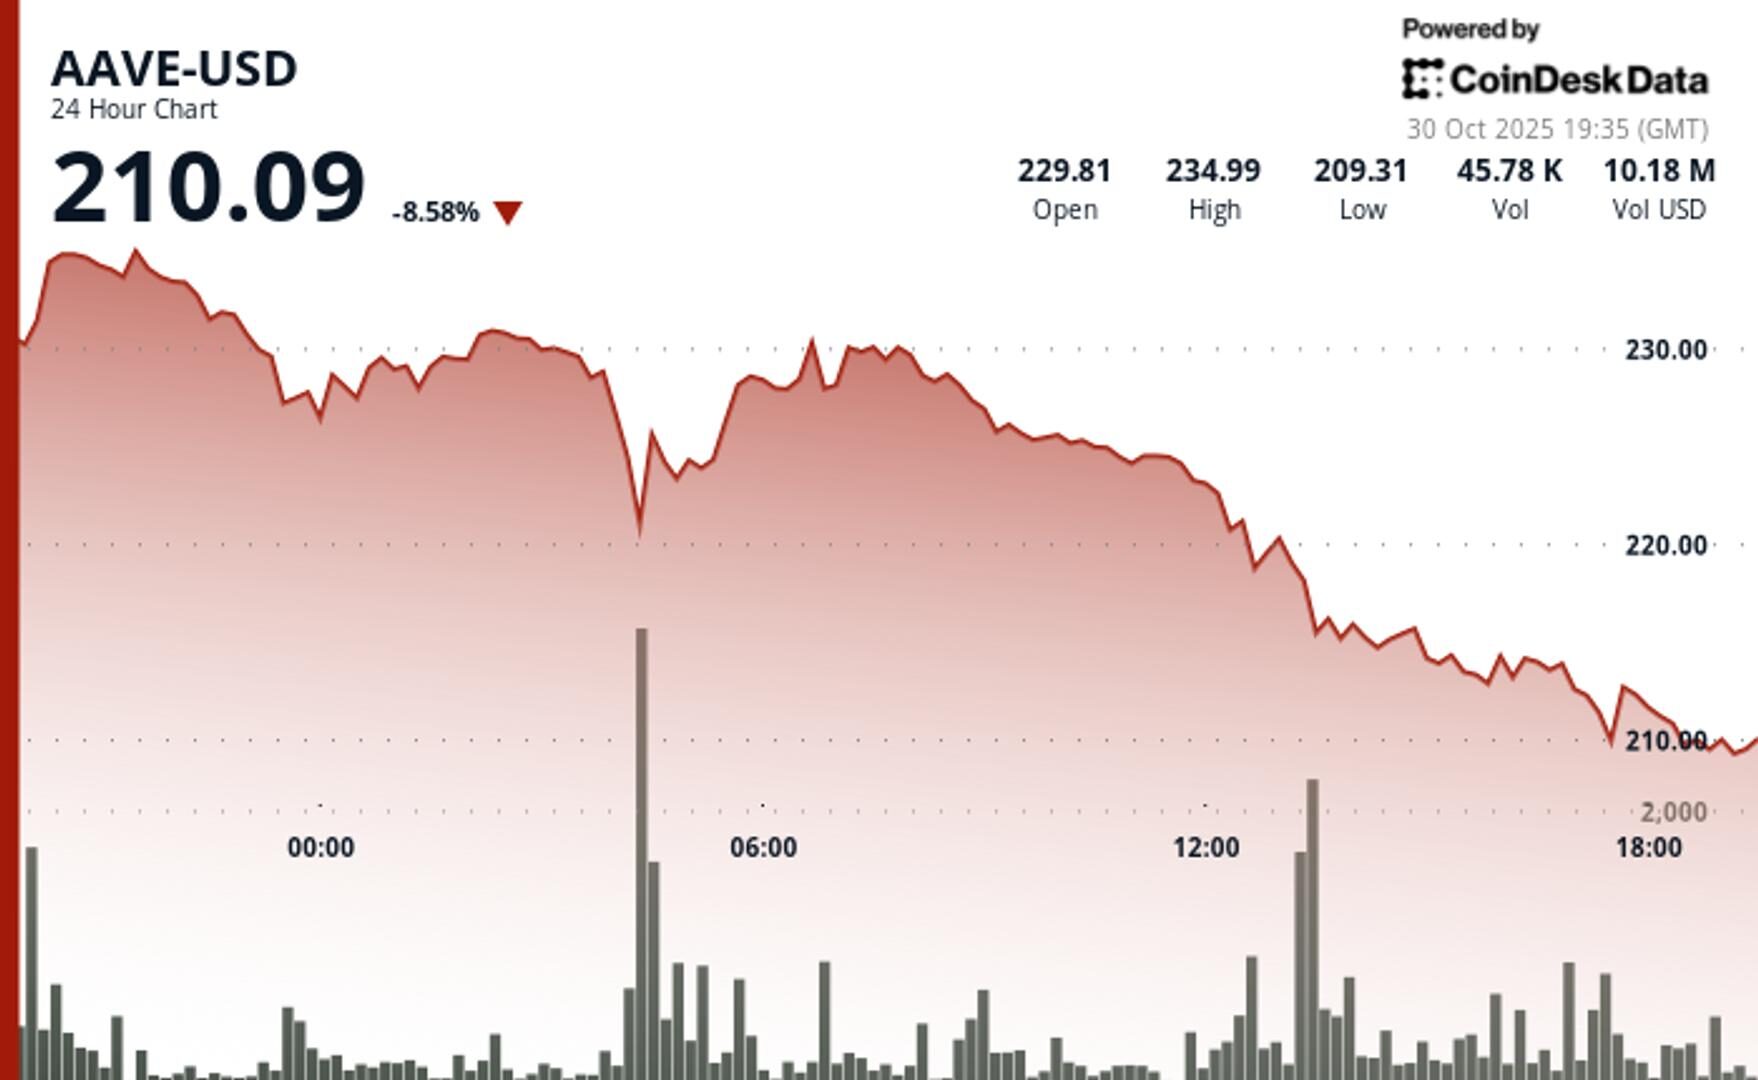
- AAVE tumbled below $210 from $248 earlier this week as crypto markets crumbled.
- Key support level at $211 broke down with consecutive lower highs, confirming the bearish shift.
- The protocol’s institutional real-world asset lending arm, Horizon, grew to $450 million in two months since launch.
Aave AAVE$210.89, the governance token of the decentralized lender, posted sharp declines through Thursday, dropping 8% to $208. Since Monday’s $248 high, the token shed over 16%.
The DeFi bluechip token carved out consecutive lower highs and lower lows, establishing clear bearish momentum while peers advanced, CoinDesk Research’s market insight tool showed. Trading activity surged 40% above seven-day averages, signaling active repricing rather than quiet drift.
STORY CONTINUES BELOW
AAVE underperformed the CoinDesk 5 Index (CD5), which fell nearly 4%, underscoring the broad-based weakness.
The correction happened despite Aave posting strong growth on its institutional real-world asset lending arm Horizon. The marketplace grew above $450 million since its launch roughly two months ago, data shows.
Key technical levels signal a potential breakdown risk for AAVE, CoinDesk Research’s market insight tool suggested.
- Support/Resistance: Critical $211.00 support failed, while the $235 level capped earlier advances forming resistance.
- Volume Analysis: Three volume spikes at $228, $219, and $213 confirmed selling waves.
- Chart Patterns: Lower highs and lower lows established bearish trend across a $26.88 range representing 11.4% overall price decline
- Targets & Risk: Failed recovery at $212.70 sets up deeper pullback.
Disclaimer: Parts of this article were generated with the assistance from AI tools and reviewed by our editorial team to ensure accuracy and adherence to our standards. For more information, see CoinDesk’s full AI Policy.
More For You
Oct 16, 2025

Stablecoin payment volumes have grown to $19.4B year-to-date in 2025. OwlTing aims to capture this market by developing payment infrastructure that processes transactions in seconds for fractions of a cent.
More For You
By Krisztian Sandor|Edited by Stephen Alpher
39 minutes ago

One onchain observer noted a large transaction by Jump Crypto, speculating that the crypto firm might be rotating SOL into BTC, perhaps weighing on sentiment.
What to know:
- Solana (SOL) fell 8% on Thursday, continuing its decline despite a solid launch of the first spot-based Solana ETFs in the U.S.
- The Bitwise Solana Staking ETF (BSOL) saw $116 million in net inflows, while the Grayscale Solana Trust (GSOL) attracted $1.4 million.
- A significant on-chain transfer by Jump Crypto may have impacted sentiment, as that firm moved 1.1 million SOL to Galaxy Digital, sparking speculation of rotating from SOL to BTC.


-
Back to menu
Prices
-
Back to menu
-
Back to menu
Indices -
Back to menu
Research
-
Back to menu
Consensus 2026 -
Back to menu
Sponsored
-
Back to menu
Videos -
Back to menu
-
Back to menu
-
Back to menu
Webinars
Select Language