HBAR Drops 5% to $0.1835 as Support Crumbles at $0.1900
-
News
-
Video
-
Consensus 2026
-
Data & Indices
Hedera token breaks key technical level amid volume surge, though late-session reversal signals emerge.
By CD Analytics, Oliver Knight
Updated Nov 3, 2025, 4:40 p.m. Published Nov 3, 2025, 4:40 p.m.

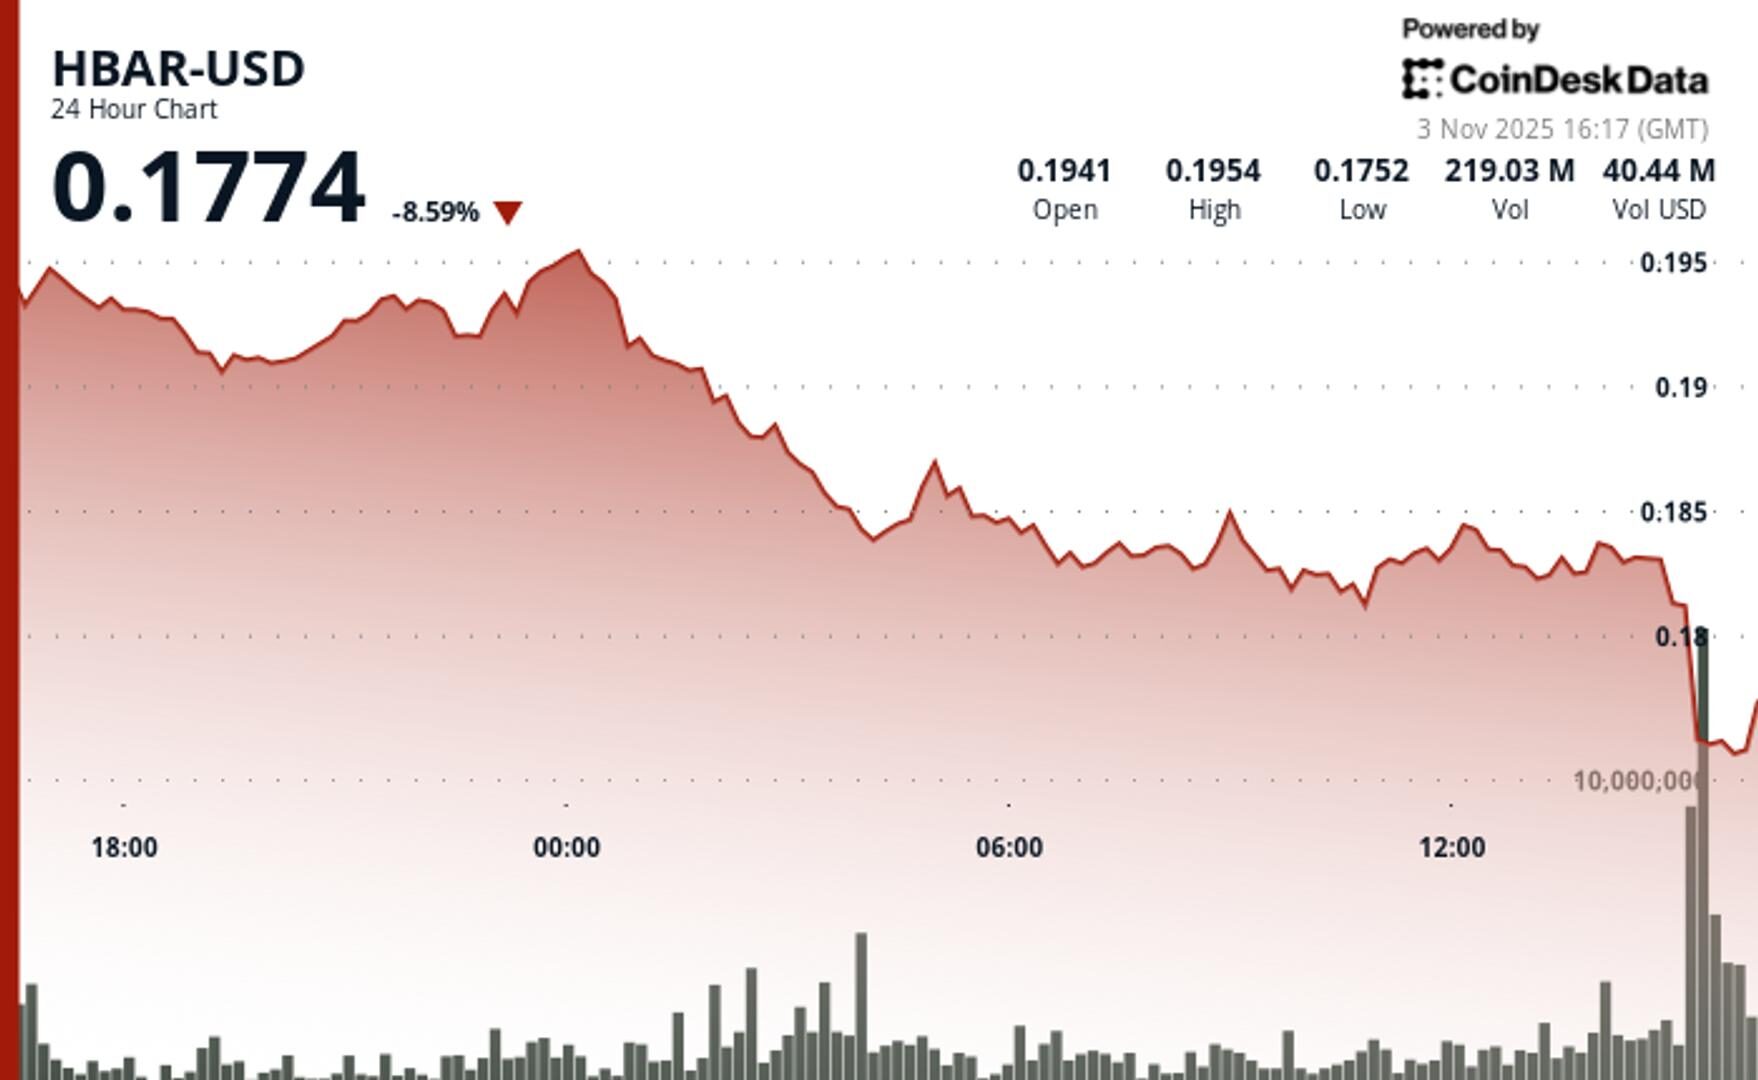
- HBAR fell 5% from $0.1932 to $0.1835 after losing its $0.1900 support, marking a decisive shift in near-term sentiment.
- Trading spiked 86% above average to 114.18 million tokens as resistance at $0.1951 triggered heavy selling pressure.
- Despite the drop, hourly charts show a bullish higher-low pattern with key resistance at $0.1850–$0.1860 and support holding around $0.1835.
Hedera’s HBAR token slid 5% over the past 24 hours, falling from $0.1932 to $0.1835 after breaching critical support at $0.1900. Sellers maintained control through the overnight hours, driving prices to test fresh lows near $0.1815 before signs of stabilization emerged.
Trading activity spiked sharply, with 114.18 million HBAR changing hands at the 16:00 GMT session peak — an 86% jump above the daily average of 61.4 million. The volume surge aligned with a failed push to reclaim $0.1951 resistance, which quickly reversed into a cascade of sell orders that cemented the breakdown below $0.1900.
STORY CONTINUES BELOW
Despite the broader bearish tone, short-term charts hint at early signs of recovery. Hourly data shows a 0.77% rebound from $0.1825 to $0.1839, supported by a 3.09 million token volume burst during a mid-session breakout attempt. Bulls managed to form a higher low pattern, reclaiming the $0.1835 level that now acts as immediate support.
Still, traders remain divided. The near-term outlook hinges on whether HBAR can extend its bounce toward the $0.1850–$0.1860 resistance cluster or risks renewed pressure below the $0.1815 floor. Technical momentum favors a cautious recovery, but sustained upside will depend on volume confirmation and broader market sentiment.
- Former Support: $0.1900 — now acting as strong overhead resistance.
- New Support Zone: $0.1815–$0.1835 following stabilization efforts.
- Immediate Upside Targets: $0.1850–$0.1860 after hourly breakout.
- Resistance Rejection: 114.18M token spike (≈86% above SMA).
- Bullish Breakout Attempt: 3.09M volume peak on hourly reversal.
- Institutional Activity: Concentrated around key technical inflection points.
- Daily Trend: Bearish, with consecutive lower lows.
- Hourly Structure: Bullish reversal with higher low formation.
- Momentum Shift: Price reclaimed $0.1835 (now support) with strength.
- Bullish Target: $0.1850–$0.1860 resistance zone.
- Bearish Risk: Breakdown below $0.1815 support zone.
- Critical Pivot: $0.1835 — key level defining near-term direction.
Disclaimer: Parts of this article were generated with the assistance from AI tools and reviewed by our editorial team to ensure accuracy and adherence to our standards. For more information, see CoinDesk’s full AI Policy.
More For You
Oct 16, 2025

Stablecoin payment volumes have grown to $19.4B year-to-date in 2025. OwlTing aims to capture this market by developing payment infrastructure that processes transactions in seconds for fractions of a cent.
More For You
By Jamie Crawley, CD Analytics|Edited by Sheldon Reback
31 minutes ago

BONK slid to $0.00001232, breaking through critical support as sales pressure swept through Solana-linked meme tokens.
What to know:
- BONK dropped 11.2% to $0.00001232, breaking below major support at $0.0000137.
- Volume spiked 46% above average, signaling strong participation from potential sellers.
- Short-term recovery attempt met resistance near $0.0000137.


-
Back to menu
Prices
-
Back to menu
-
Back to menu
Indices -
Back to menu
Research
-
Back to menu
Consensus 2026 -
Back to menu
Sponsored
-
Back to menu
Videos -
Back to menu
-
Back to menu
-
Back to menu
Webinars
Select Language