HBAR Drops 0.6% to $0.18 Amid Indecisive Trading Session
-
News
-
Video
-
Consensus 2026
-
Data & Indices
Hedera’s native token breaks key support in final trading hour as institutional focus shifts to regulatory-friendly blockchain alternatives.
By CD Analytics, Oliver Knight
Updated Nov 12, 2025, 5:19 p.m. Published Nov 12, 2025, 5:19 p.m.

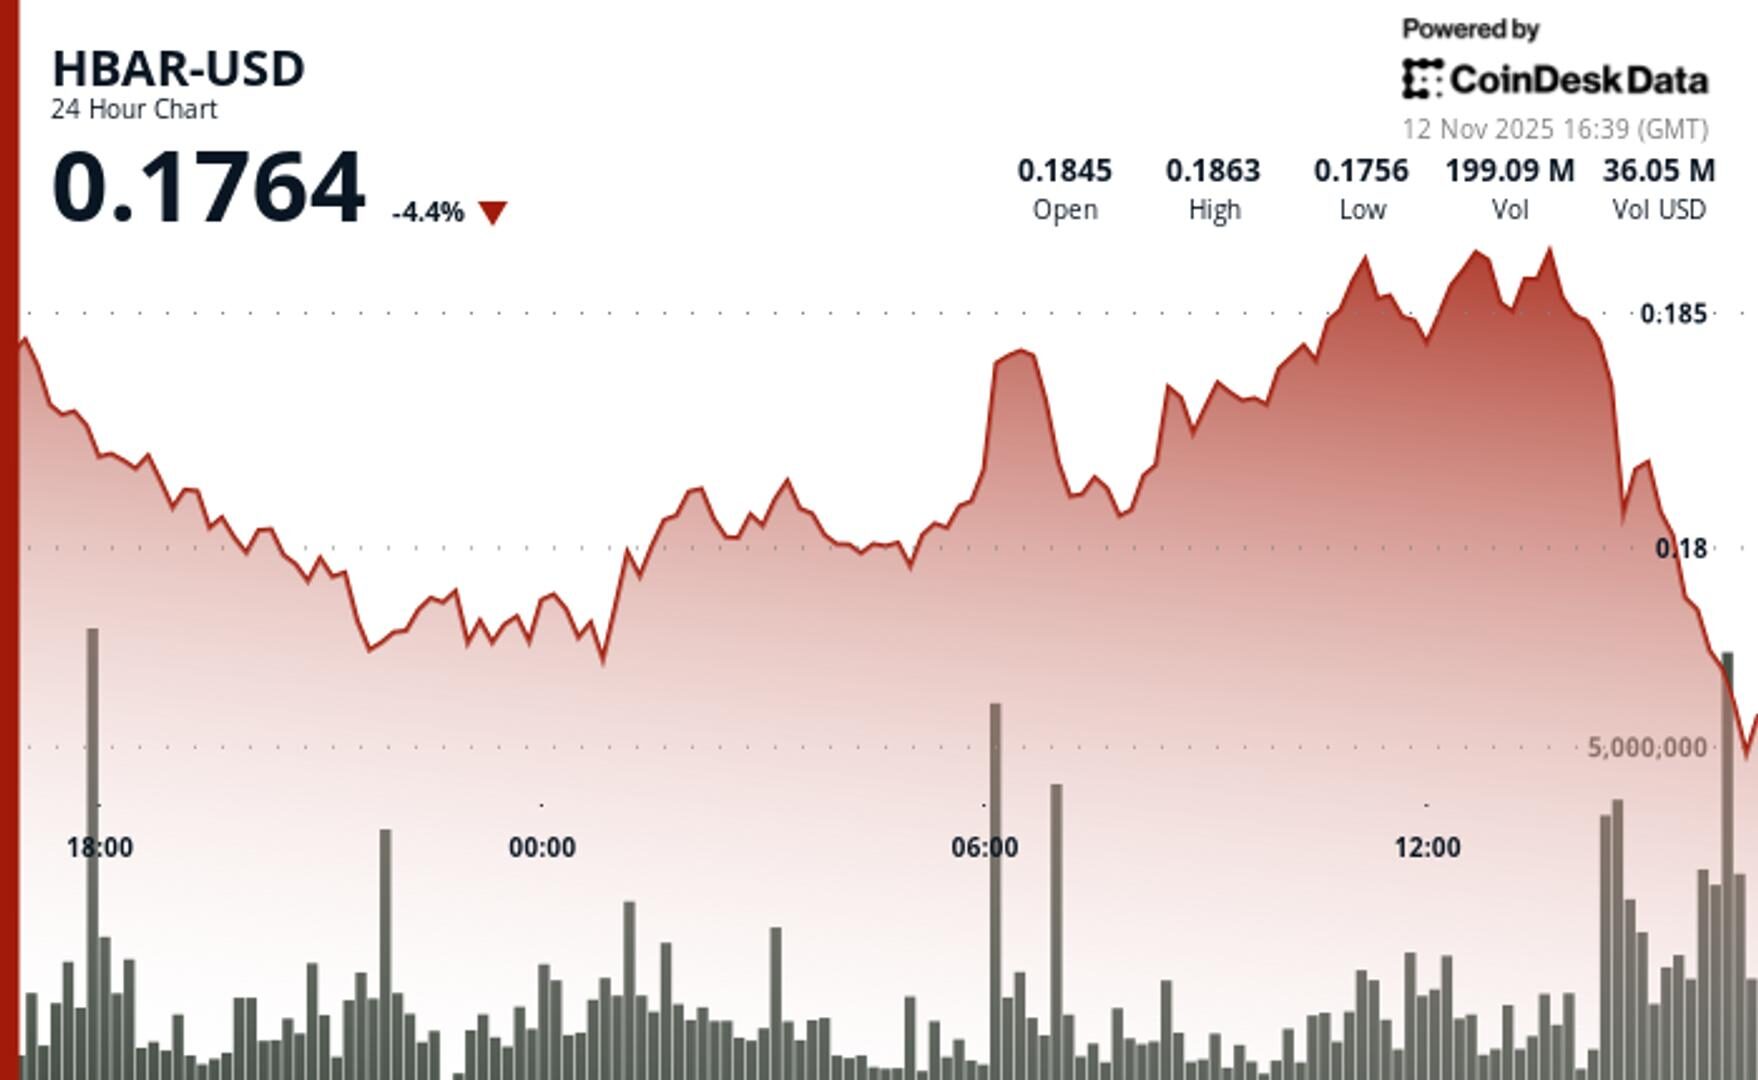
- HBAR declined 0.6% in volatile session, trading between $0.1775-$0.1865 range
- Token broke below critical $0.1775 support level during final hour selling pressure
- Technical factors dominated as broader altcoin momentum shifted toward XRP ETF developments
HBAR slipped 0.6% to $0.1849 in Tuesday’s volatile session, testing the lower boundary of its recent trading range.
The decline from $0.1860 unfolded across a $0.0090 range, generating nearly 5% intraday volatility as traders probed key support and resistance levels.
STORY CONTINUES BELOW
Trading activity spiked, with volume hitting 85.9 million tokens—47% above the session average—reflecting intensified selling near the $0.1860 resistance zone.
The token initially found support at $0.1775 before rebounding to $0.1865 by mid-session. However, renewed selling pressure emerged in the final hour, pushing prices below crucial support and cementing a short-term bearish tone heading into Wednesday.
Still, the bearish technical outlook contrasts with Hedera’s strong enterprise positioning. Partnerships with Google Cloud, IBM, and Boeing continue to highlight its institutional relevance in the blockchain sector.

- Support/Resistance: Primary support shifts to $0.1840-0.1845 zone following breakdown, while resistance holds at $0.1860-0.1865 range highs from Tuesday’s session.
- Volume Analysis: 85.9M token volume spike at resistance confirmed selling interest, though activity normalized during final hour decline to below-average levels.
- Chart Patterns: Range-bound structure between $0.1775-0.1865 invalidated on downside break, establishing new lower consolidation framework around current levels.
- Targets & Risk/Reward: Immediate downside target at $0.1840-0.1845 represents 0.3-0.5% decline from current levels, while reclaim of $0.1860 triggers retest of $0.1865 range highs.
Disclaimer: Parts of this article were generated with the assistance from AI tools and reviewed by our editorial team to ensure accuracy and adherence to our standards. For more information, see CoinDesk’s full AI Policy.
More For You
Oct 16, 2025

Stablecoin payment volumes have grown to $19.4B year-to-date in 2025. OwlTing aims to capture this market by developing payment infrastructure that processes transactions in seconds for fractions of a cent.
More For You
By CD Analytics, Siamak Masnavi
15 minutes ago

Institutional inflows of $336 million fail to offset selling pressure as SOL falls to $153 amid fresh token releases.
What to know:
- SOL dropped 4.9% to $153.49 despite recording $336 million in weekly ETF inflows.
- Alameda Research unlocked another 193,000 SOL tokens valued at approximately $30 million.
- Technical breakdown below $156 support accelerates selling toward $152.80 demand zone.


-
Back to menu
Prices
-
Back to menu
-
Back to menu
Indices -
Back to menu
Research
-
Back to menu
Consensus 2026 -
Back to menu
Sponsored
-
Back to menu
Videos -
Back to menu
-
Back to menu
-
Back to menu
Webinars
Select Language