BONK Declines 5% to $0.00001223 as Resistance Holds and Volume Surges 48%
-
News
-
Video
-
Consensus 2026
-
Data & Indices
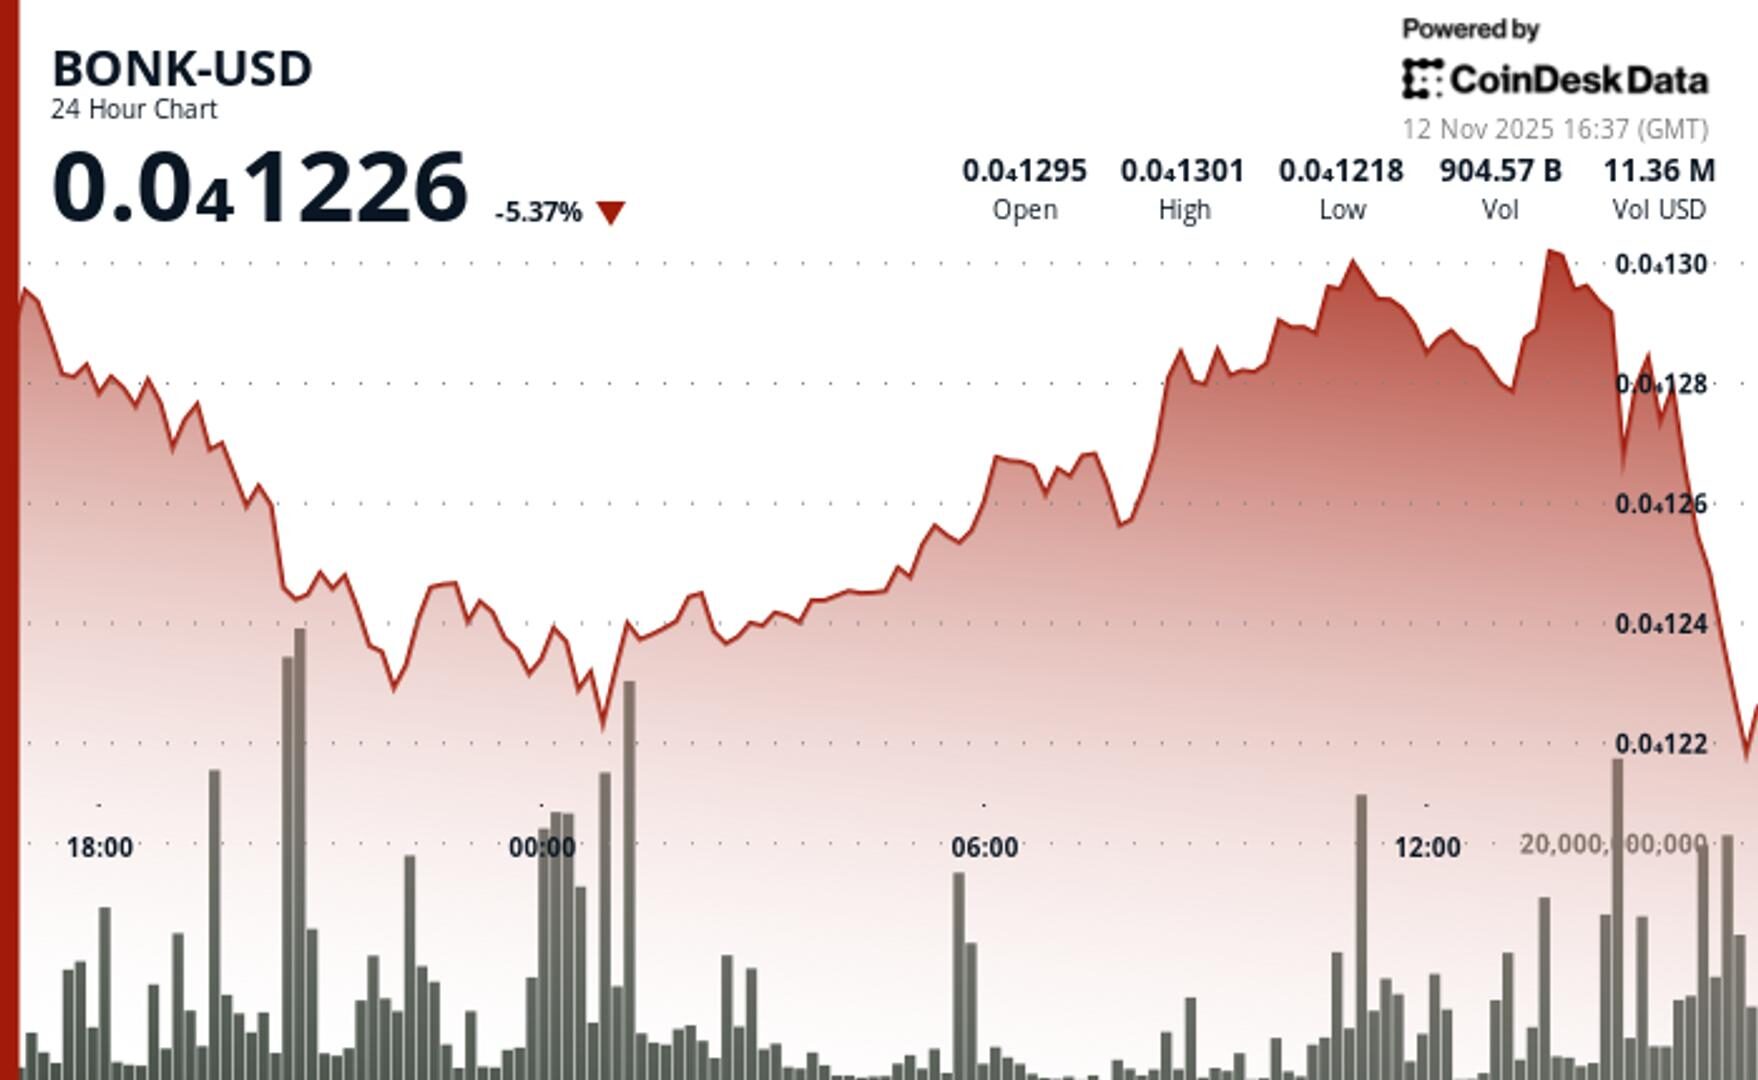
BONK slipped 5% to $0.00001223 after failing to break resistance near $0.0000130, with trading volume spiking nearly 50% above average during the pullback.
By Jamie Crawley, CD Analytics|Edited by Nikhilesh De
Nov 12, 2025, 5:08 p.m.

- BONK fell 5% to $0.00001223 after rejection near $0.0000130 resistance.
- Trading volume jumped 48% above its daily average during the failed breakout attempt.
- Price tested $0.00001223 support as volatility remained elevated across the Solana ecosystem.
BONK dropped more than 5% to $0.00001213 over the past 24 hours as the Solana-based meme token failed to sustain momentum above key resistance levels.
The decline came after a brief attempt to rally past $0.0000130, which was quickly reversed amid heavy trading activity, according to CoinDesk Research’s technical analysis data model.
STORY CONTINUES BELOW
Volume peaked at 813.46 billion tokens, nearly 50% above the 24-hour average. The move coincided with BONK’s sharp rejection at the $0.0000130 level, confirming short-term resistance. Following the reversal, the token slid toward $0.00001223, where short-term support formed to prevent a deeper decline.
Intraday volatility reached 6.6%, with price oscillations confined within a $0.0000086 range. Hourly data shows a brief rebound from $0.00001280 to $0.00001301, followed by a swift retracement that erased most gains as momentum weakened.
While broader market sentiment stabilized, BONK’s price action reflected continued uncertainty typical of meme tokens. The rejection pattern reinforced the prevailing downtrend, suggesting consolidation may persist between $0.00001223 and $0.00001295 unless volume expansion supports a breakout attempt.
Disclaimer: Parts of this article were generated with the assistance from AI tools and reviewed by our editorial team to ensure accuracy and adherence to our standards. For more information, see CoinDesk’s full AI Policy.
More For You
Oct 16, 2025

Stablecoin payment volumes have grown to $19.4B year-to-date in 2025. OwlTing aims to capture this market by developing payment infrastructure that processes transactions in seconds for fractions of a cent.
More For You
By CD Analytics, Siamak Masnavi
15 minutes ago

Institutional inflows of $336 million fail to offset selling pressure as SOL falls to $153 amid fresh token releases.
What to know:
- SOL dropped 4.9% to $153.49 despite recording $336 million in weekly ETF inflows.
- Alameda Research unlocked another 193,000 SOL tokens valued at approximately $30 million.
- Technical breakdown below $156 support accelerates selling toward $152.80 demand zone.


-
Back to menu
Prices
-
Back to menu
-
Back to menu
Indices -
Back to menu
Research
-
Back to menu
Consensus 2026 -
Back to menu
Sponsored
-
Back to menu
Videos -
Back to menu
-
Back to menu
-
Back to menu
Webinars
Select Language