HBAR Drops 3.5% Breaking Support as ETF Inflows Hit $68 Million
-
News
-
Video
-
Consensus 2026
-
Data & Indices
By CD Analytics, Oliver Knight
Updated Nov 13, 2025, 4:49 p.m. Published Nov 13, 2025, 4:49 p.m.

- HBAR breached $0.1754 support level during final trading hour selloff.
- Canary HBAR ETF accumulates $68 million across six consecutive sessions.
- Google Cloud BigQuery partnership fails to offset technical breakdown.
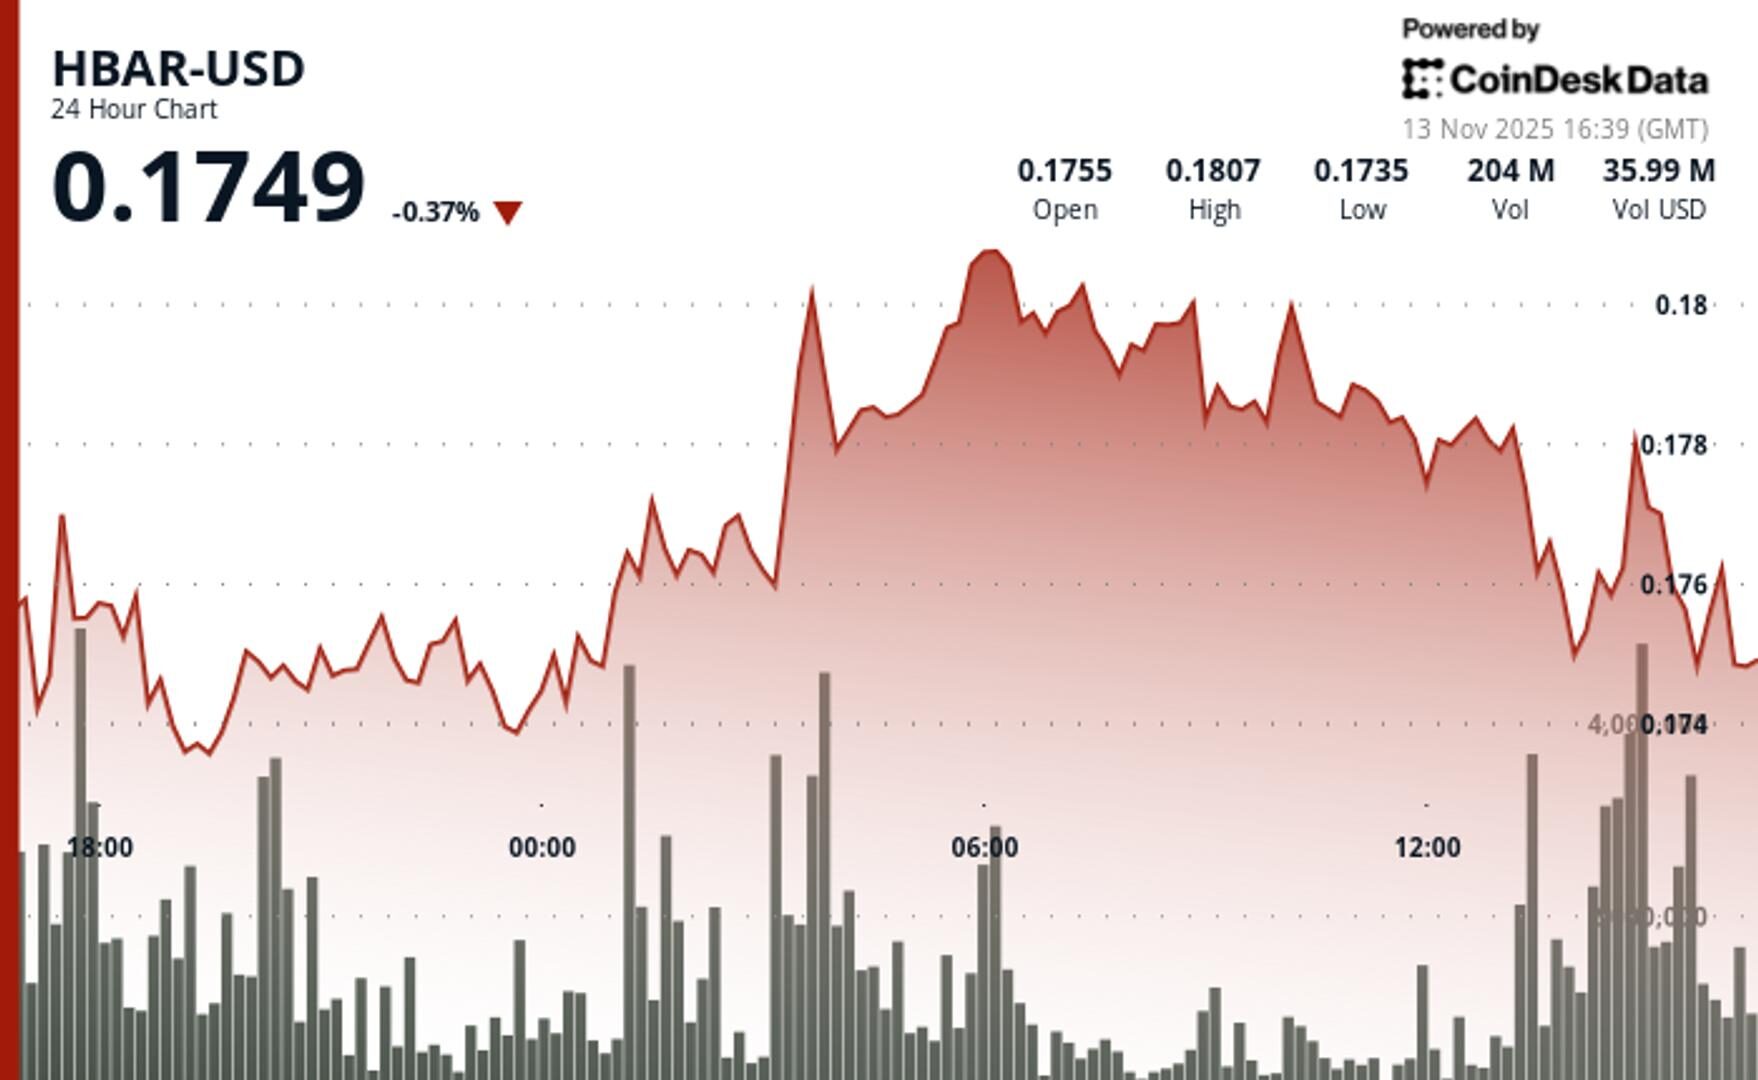
HBAR retreated 3.5% from $0.1817 to $0.1754 during Wednesday’s session, breaking key support despite institutional flows reaching $68 million through ETF channels.
The token faced rejection at $0.1805 resistance following a morning spike that peaked at $0.1802 on significant volume—79% above daily averages.
STORY CONTINUES BELOW
Volume dried up following the initial morning surge, suggesting institutional buyers stepped back while retail participants drove the late-session weakness. The 4.5% intraday range reflects heightened volatility despite muted cryptocurrency market conditions.
HBAR’s price weakness contrasts sharply with institutional positioning through the Canary HBAR ETF, which accumulated $68 million over six trading sessions. Thirteen total ETF filings now include HBAR exposure, signaling growing institutional appetite for Hedera ecosystem exposure.

- Support/Resistance: Critical support at $0.1740 now tested with resistance firmly established at $0.1805 following multiple rejections.
- Volume Analysis: Morning spike reaching 125.8 million shares marked 79% above averages but generated insufficient follow-through buying.
- Chart Patterns: Distribution structure confirms bearish momentum with consecutive lower highs signaling continued downside pressure.
- Targets & Risk/Reward: Immediate targets point toward $0.1720-$0.1700 support zone with upside capped at $0.1805 resistance barrier.
Disclaimer: Parts of this article were generated with the assistance from AI tools and reviewed by our editorial team to ensure accuracy and adherence to our standards. For more information, see CoinDesk’s full AI Policy.
More For You
Oct 16, 2025

Stablecoin payment volumes have grown to $19.4B year-to-date in 2025. OwlTing aims to capture this market by developing payment infrastructure that processes transactions in seconds for fractions of a cent.
More For You
By Jamie Crawley, CD Analytics|Edited by Sheldon Reback
12 minutes ago
Internet Computer trades within a narrow range after an early-volume breakout attempt stalled, keeping the token pinned between key support at $6.05 and $6.66.
What to know:
- ICP experienced a 68% above-average volume spike during a test of $6.66 resistance that failed to break through.
- Activity fell sharply, including several minutes of zero trades, underscoring the current equilibrium.
- ICP remains bound between $6.05 support and $6.66 resistance as traders await a volume-driven directional move.


-
Back to menu
Prices
-
Back to menu
-
Back to menu
Indices -
Back to menu
Research
-
Back to menu
Consensus 2026 -
Back to menu
Sponsored
-
Back to menu
Videos -
Back to menu
-
Back to menu
-
Back to menu
Webinars
Select Language