XLM Slips 3.2% to $0.250 as Altcoin Purge Continues
-
News
-
Video
-
Consensus 2026
-
Data & Indices
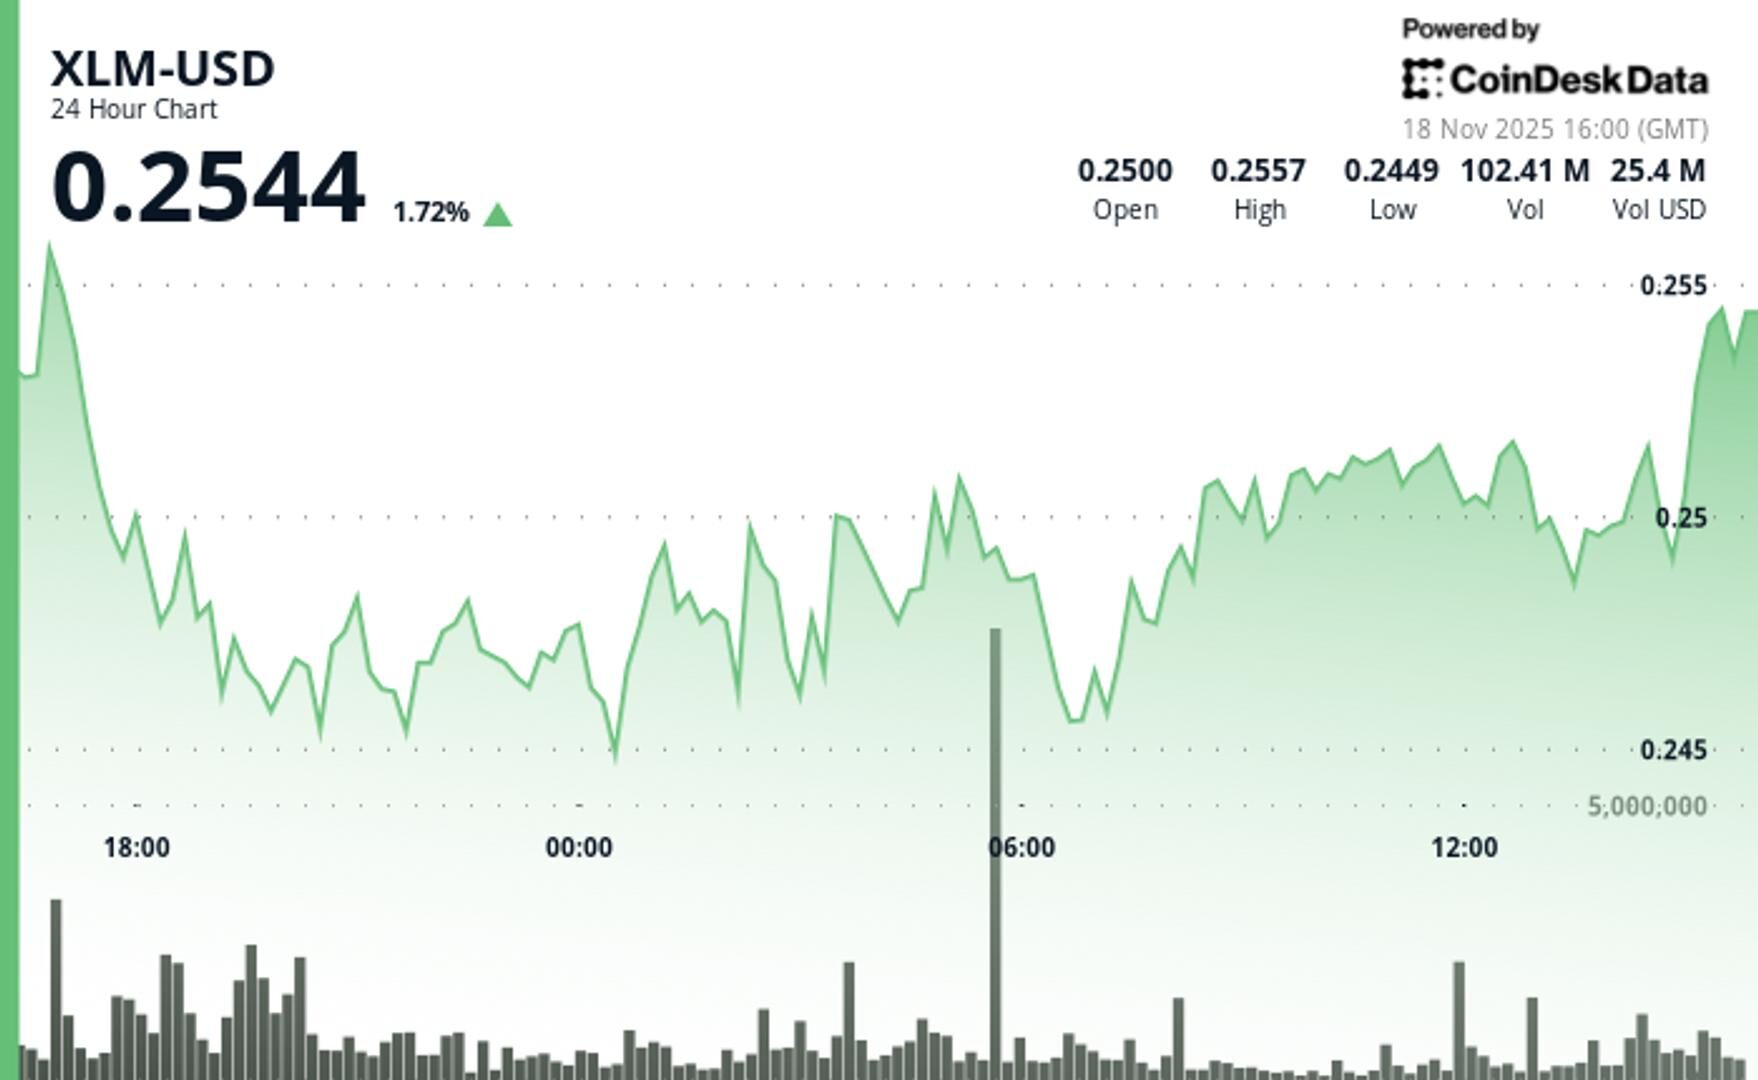
Stellar drops from $0.2577 amid broad consolidation, but technical bounce from $0.248 signals buying interest remains intact.
By CD Analytics, Oliver Knight
Updated Nov 18, 2025, 4:04 p.m. Published Nov 18, 2025, 4:04 p.m.

- XLM fell from $0.2577 to $0.2495 in 24-hour period with 6.1% intraday range.
- Volume surged 87% above average to 65.4 million, confirming resistance at $0.2558.
- Recent data shows sharp V-shaped recovery from $0.248 support level.
Stellar (XLM) slipped 3.2% on Tuesday, falling from $0.2577 to $0.2495 as altcoins broadly consolidated and momentum cooled. The token briefly tapped resistance at $0.2558 on unusually heavy volume—87% above its 24-hour average—before sellers regained control.
Short-term charts show stabilizing conditions, with XLM forming a clear intraday base at $0.248 before rebounding to reclaim the $0.250 psychological level. Hourly volume spikes near 1 million tokens signaled renewed accumulation, while a series of higher lows pointed to improving momentum despite broader market softness.
STORY CONTINUES BELOW
Traders are now watching the $0.248–$0.250 band, which has emerged as a key pivot zone amid sector-wide consolidation.
A firm defense of support, alongside XLM’s ability to maintain an $8 billion market cap, underscores steady demand for its cross-border payments utility—even as altcoins across the DeFi landscape continue to face pressure.

Support/Resistance:
- Primary support holds at $0.248 with secondary floor at $0.2452.
- Key resistance remains at $0.2558 with $0.250 psychological level reclaimed.
- Trading range between $0.248-$0.2577 defines near-term boundaries.
Volume Analysis:
- Exceptional selling volume of 65.4M confirmed strong resistance rejection.
- Accumulation spikes of 988K and 871K validated support zone buying.
- Volume drop to 2.5M in final hours suggests selling exhaustion.
Chart Patterns:
- V-shaped recovery from $0.248 low shows strong support demand.
- Three distinct rejection phases confirmed bearish momentum structure.
- Higher lows from $0.248 to $0.249 indicate potential reversal setup.
Targets & Risk/Reward:
- Next resistance target at $0.2558 with breakout potential toward $0.2577.
- Downside risk limited by $0.248 support, stop-loss below $0.2452.
- Current $0.250 level offers favorable risk/reward for long positions.
Disclaimer: Parts of this article were generated with the assistance from AI tools and reviewed by our editorial team to ensure accuracy and adherence to our standards. For more information, see CoinDesk’s full AI Policy.
More For You
Nov 14, 2025

What to know:
- As of October 2025, GoPlus has generated $4.7M in total revenue across its product lines. The GoPlus App is the primary revenue driver, contributing $2.5M (approx. 53%), followed by the SafeToken Protocol at $1.7M.
- GoPlus Intelligence’s Token Security API averaged 717 million monthly calls year-to-date in 2025 , with a peak of nearly 1 billion calls in February 2025. Total blockchain-level requests, including transaction simulations, averaged an additional 350 million per month.
- Since its January 2025 launch , the $GPS token has registered over $5B in total spot volume and $10B in derivatives volume in 2025. Monthly spot volume peaked in March 2025 at over $1.1B , while derivatives volume peaked the same month at over $4B.
More For You
By CD Analytics, Oliver Knight
7 minutes ago

Hedera’s native token cracked key support levels on surging volume, forming double-bottom pattern before late-session stabilization attempts.
What to know:
- HBAR plunged from $0.1507 to $0.1447 over 24 hours, erasing 5.9% of value.
- Trading volume spiked 71% above average as $0.1500 resistance triggered massive selling.
- Double-bottom formation at $0.144 signals potential seller exhaustion ahead.


-
Back to menu
Prices
-
Back to menu
-
Back to menu
Indices -
Back to menu
Research
-
Back to menu
Consensus 2026 -
Back to menu
Sponsored
-
Back to menu
Videos -
Back to menu
-
Back to menu
-
Back to menu
Webinars
Select Language