XLM Drops 1.6% Breaking Key $0.25 Support Level
-
News
-
Video
-
Consensus 2026
-
Data & Indices
By CD Analytics, Oliver Knight
Updated Nov 19, 2025, 5:10 p.m. Published Nov 19, 2025, 5:10 p.m.

- XLM fell from $0.2491 to $0.2451 with clear bearish momentum confirmed.
- Trading volume jumped 78% above average during critical support breakdown.
- Multiple technical levels violated as downside pressure intensified rapidly.
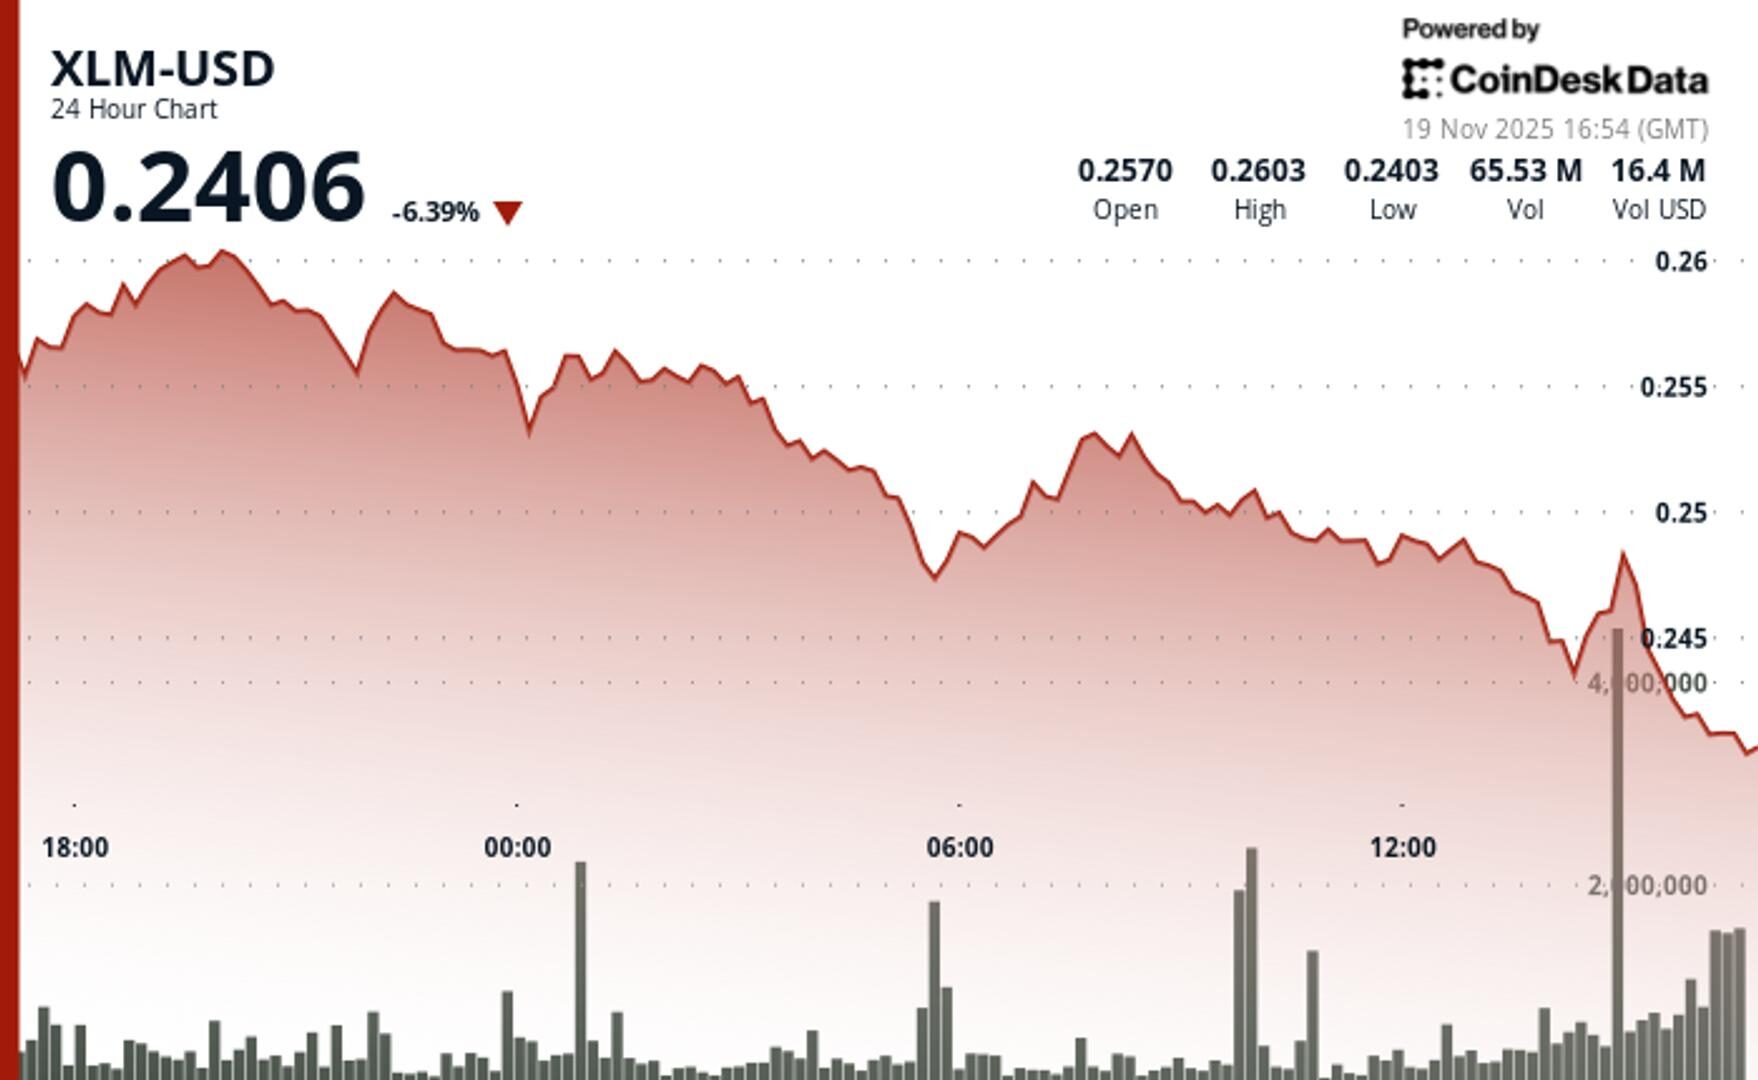
Stellar (XLM) slipped 1.6% on Tuesday, dropping from $0.2491 to $0.2451 as sellers took control and the token extended a series of lower highs from its recent $0.2602 peak.
The asset traded within a $0.0153 range, posting 6.2% intraday volatility. A sharp 05:00 volume spike of 36.3 million XLM — 78% above the 24-hour average — confirmed a breakdown below the key $0.2520 support level.
STORY CONTINUES BELOW
With no clear fundamental catalysts, traders focused on the technical picture, where the loss of $0.2520 signaled likely institutional distribution rather than retail-driven volatility.
Bearish momentum intensified on the one hour chart as XLM fell another 0.8%, sliding from $0.2478 to $0.2453. Two forceful selling waves drove the token below $0.2470 and $0.2460, with back-to-back volume surges of 1.71 million and 1.69 million tokens during the a one minute window — more than eight times typical levels.

- Immediate support holds at $0.2449 session lows.
- Strong resistance confirmed near $0.2600 level.
- Critical support breakdown completed at $0.2520.
- 36.3 million volume spike marked 78% above daily average.
- Consecutive 1.7 million+ volume surges during breakdown.
- 8x normal volume levels confirmed institutional selling.
- Consecutive lower highs pattern from $0.2602 peak.
- Accelerating bearish momentum through support violations.
- Two-wave selling structure dominates 60-minute chart.
- Downside target sits at $0.2430 if momentum continues.
- Resistance builds at $0.2520 as former support flips.
- Key reversal level remains $0.2600 for recovery attempts.
Disclaimer: Parts of this article were generated with the assistance from AI tools and reviewed by our editorial team to ensure accuracy and adherence to our standards. For more information, see CoinDesk’s full AI Policy.
More For You
Nov 14, 2025

What to know:
- As of October 2025, GoPlus has generated $4.7M in total revenue across its product lines. The GoPlus App is the primary revenue driver, contributing $2.5M (approx. 53%), followed by the SafeToken Protocol at $1.7M.
- GoPlus Intelligence’s Token Security API averaged 717 million monthly calls year-to-date in 2025 , with a peak of nearly 1 billion calls in February 2025. Total blockchain-level requests, including transaction simulations, averaged an additional 350 million per month.
- Since its January 2025 launch , the $GPS token has registered over $5B in total spot volume and $10B in derivatives volume in 2025. Monthly spot volume peaked in March 2025 at over $1.1B , while derivatives volume peaked the same month at over $4B.
More For You
By Krisztian Sandor|Edited by Stephen Alpher
55 minutes ago

After a rare spot of outperformance on Tuesday, bitcoin has resumed sliding, with one analyst eyeing $84,000–$86,000 as potential local bottom.
What to know:
- Bitcoin fell below $90,000, losing 4.2% during early U.S. trading hours on Wednesday, while ether dropped 6% to under $3,000.
- Crypto-related equities more than mirrored the decline, with Strategy (MSTR), BitMine (BMNR) and Circle (CRCL) booking 8%-9% selloffs.
- Bitcoin’s current slide from its early October record at $126,000 ranks among the steepest 43-day drawdowns since 2017, K33’s research head said.


-
Back to menu
Prices
-
Back to menu
-
Back to menu
Indices -
Back to menu
Research
-
Back to menu
Consensus 2026 -
Back to menu
Sponsored
-
Back to menu
Videos -
Back to menu
-
Back to menu
-
Back to menu
Webinars
Select Language