XLM Climbs 2% as Volume Spikes Signal Institutional Interest
-
News
-
Video
-
Consensus 2026
-
Data & Indices
By CD Analytics, Oliver Knight
Updated Dec 3, 2025, 4:44 p.m. Published Dec 3, 2025, 4:44 p.m.
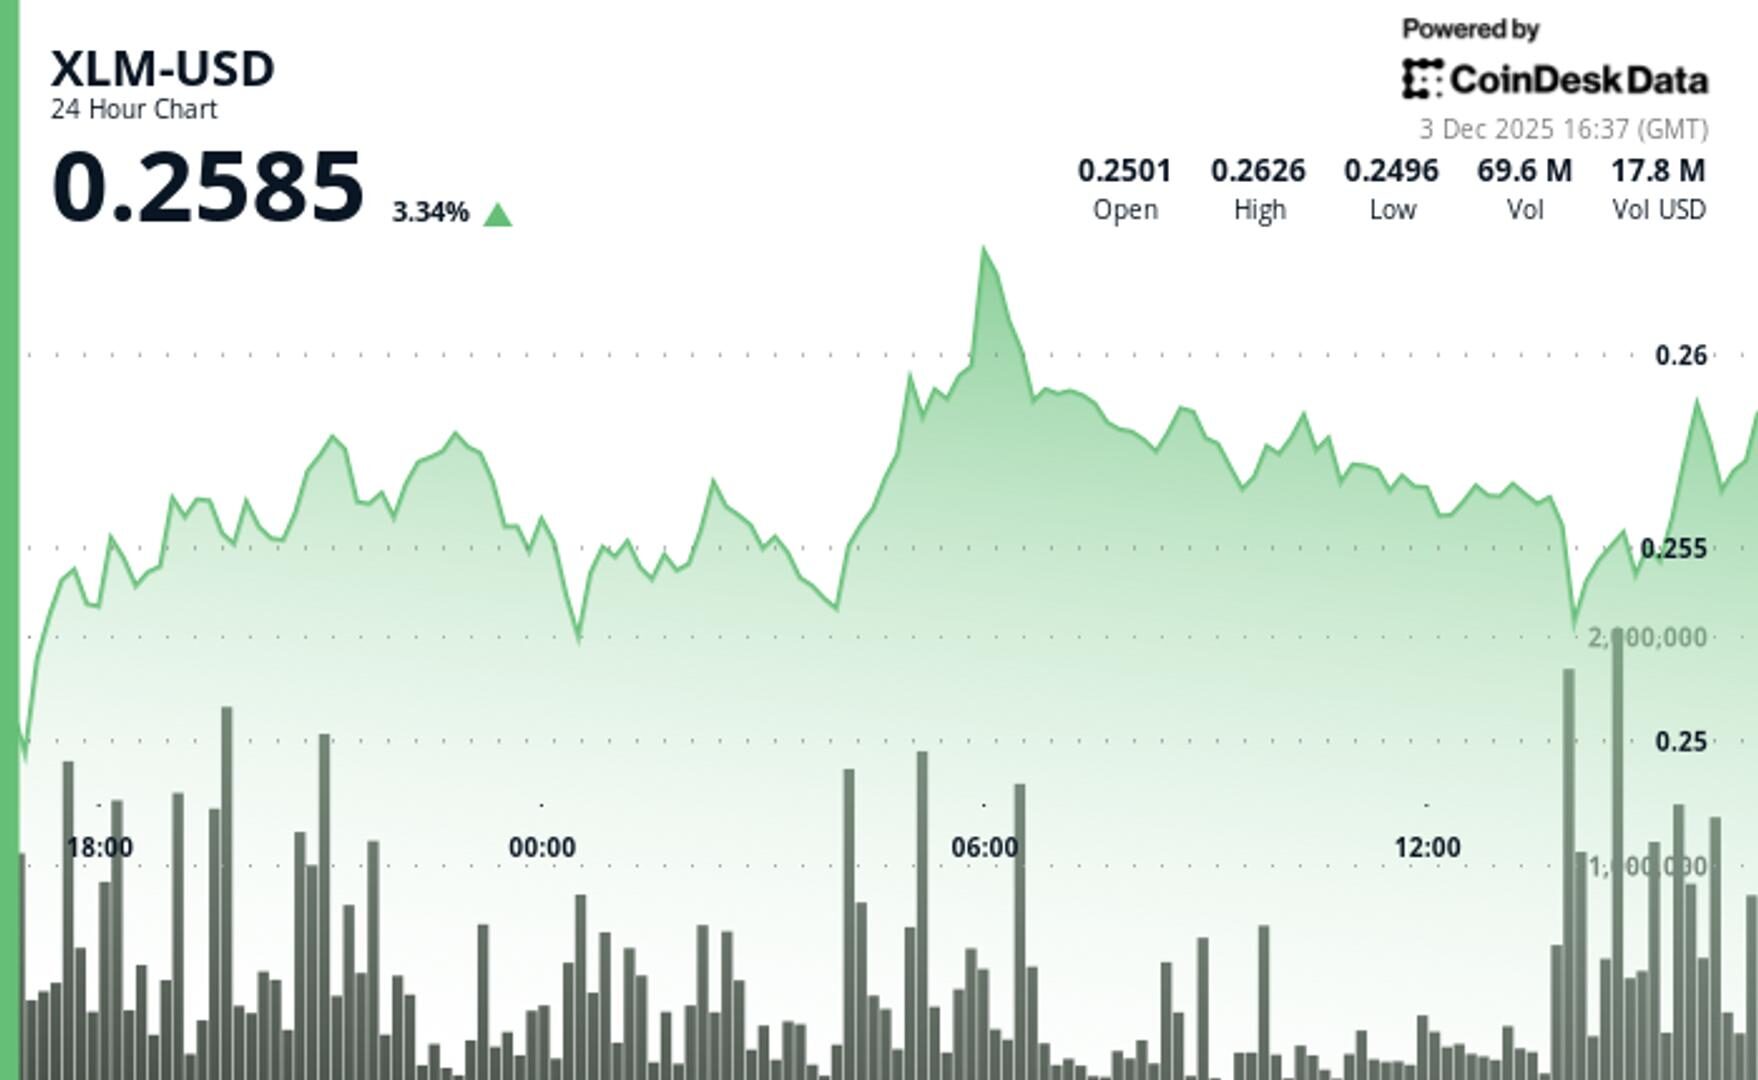
- Stellar gained from $0.252 to $0.258 over 24-hour period with higher lows pattern.
- Volume spiked 37% above 7-day average signaling increased institutional positioning.
- Technical breakout above $0.2556 resistance confirms amid exceptional volume bursts.
Stellar climbed 1.79% to $0.256 during Tuesday’s session. The digital asset posted modest gains that tracked broader crypto momentum. XLM advanced from $0.2516 to $0.2579 over the 24-hour period ending Dec. 3 at 15:00 GMT. The token established higher lows at $0.2500, $0.2530, and $0.2540.
Trading volume tells the real story. Activity surged 37% above the 7-day average. This signals institutional accumulation despite contained price action. XLM moved within a $0.0131 range (5.1%).
STORY CONTINUES BELOW
Technical levels dominate near-term direction without clear fundamental catalysts. XLM hit resistance at $0.2631 during morning trading on elevated volume. The asset accelerated through multiple higher highs throughout the session. The largest volume spike hit 74.27 million tokens at 14:00 GMT—163% above the 24-hour average of 27.9 million.
Recent 60-minute data shows pronounced acceleration patterns. XLM broke $0.2556 resistance and surged to $0.2588. Exceptional volume spikes exceeded 1.9 million shares at 15:34 and 1.7 million at 15:48. Volume exhaustion emerged during final hours. This potentially signals consolidation before the next move as institutional flows target broader resistance levels.

Support/Resistance: Primary support holds at $0.2519 with successful test, while resistance emerges at $0.2631 during volume surge.
Volume Analysis: Largest spike hit 74.27 million shares (163% above 24-hour SMA), confirming institutional participation during upward push.
Chart Patterns: Clear ascending trend with higher lows pattern and successful breakout above $0.2556 resistance level.
Targets & Risk/Reward: Immediate target at $0.2631 resistance offers 2.6% upside, while break above targets higher levels for additional gains.
Disclaimer: Parts of this article were generated with the assistance from AI tools and reviewed by our editorial team to ensure accuracy and adherence to our standards. For more information, see CoinDesk’s full AI Policy.
More For You
Nov 14, 2025

What to know:
- As of October 2025, GoPlus has generated $4.7M in total revenue across its product lines. The GoPlus App is the primary revenue driver, contributing $2.5M (approx. 53%), followed by the SafeToken Protocol at $1.7M.
- GoPlus Intelligence’s Token Security API averaged 717 million monthly calls year-to-date in 2025 , with a peak of nearly 1 billion calls in February 2025. Total blockchain-level requests, including transaction simulations, averaged an additional 350 million per month.
- Since its January 2025 launch , the $GPS token has registered over $5B in total spot volume and $10B in derivatives volume in 2025. Monthly spot volume peaked in March 2025 at over $1.1B , while derivatives volume peaked the same month at over $4B.
More For You
By James Van Straten|Edited by Stephen Alpher
29 minutes ago

So-called “backwardation” — a futures price curve moving lower in value as time gets further out — can be read as a measure of stress in the market.
What to know:
- Backwardation signals that futures prices are now below near term levels, reflecting cautious forward pricing and weakened expectations among institutional traders.
- The structure often emerges during forced de-risking and has historically appeared near major or local bottoms.


-
Back to menu
-
Back to menu
Prices
-
Back to menu
-
Back to menu
Indices -
Back to menu
Research
-
Back to menu
Consensus 2026 -
Back to menu
Sponsored
-
Back to menu
-
Back to menu
Podcasts -
Back to menu
-
Back to menu
Webinars
Select Language