HBAR Edges Higher as Vanguard ETF Access Expands Institutional Appeal
-
News
-
Video
-
Consensus 2026
-
Data & Indices
Hedera gains on elevated volume while establishing support above $0.1427 during measured advance that coincides with significant institutional developments.
By CD Analytics, Oliver Knight
Updated Dec 3, 2025, 4:36 p.m. Published Dec 3, 2025, 4:36 p.m.

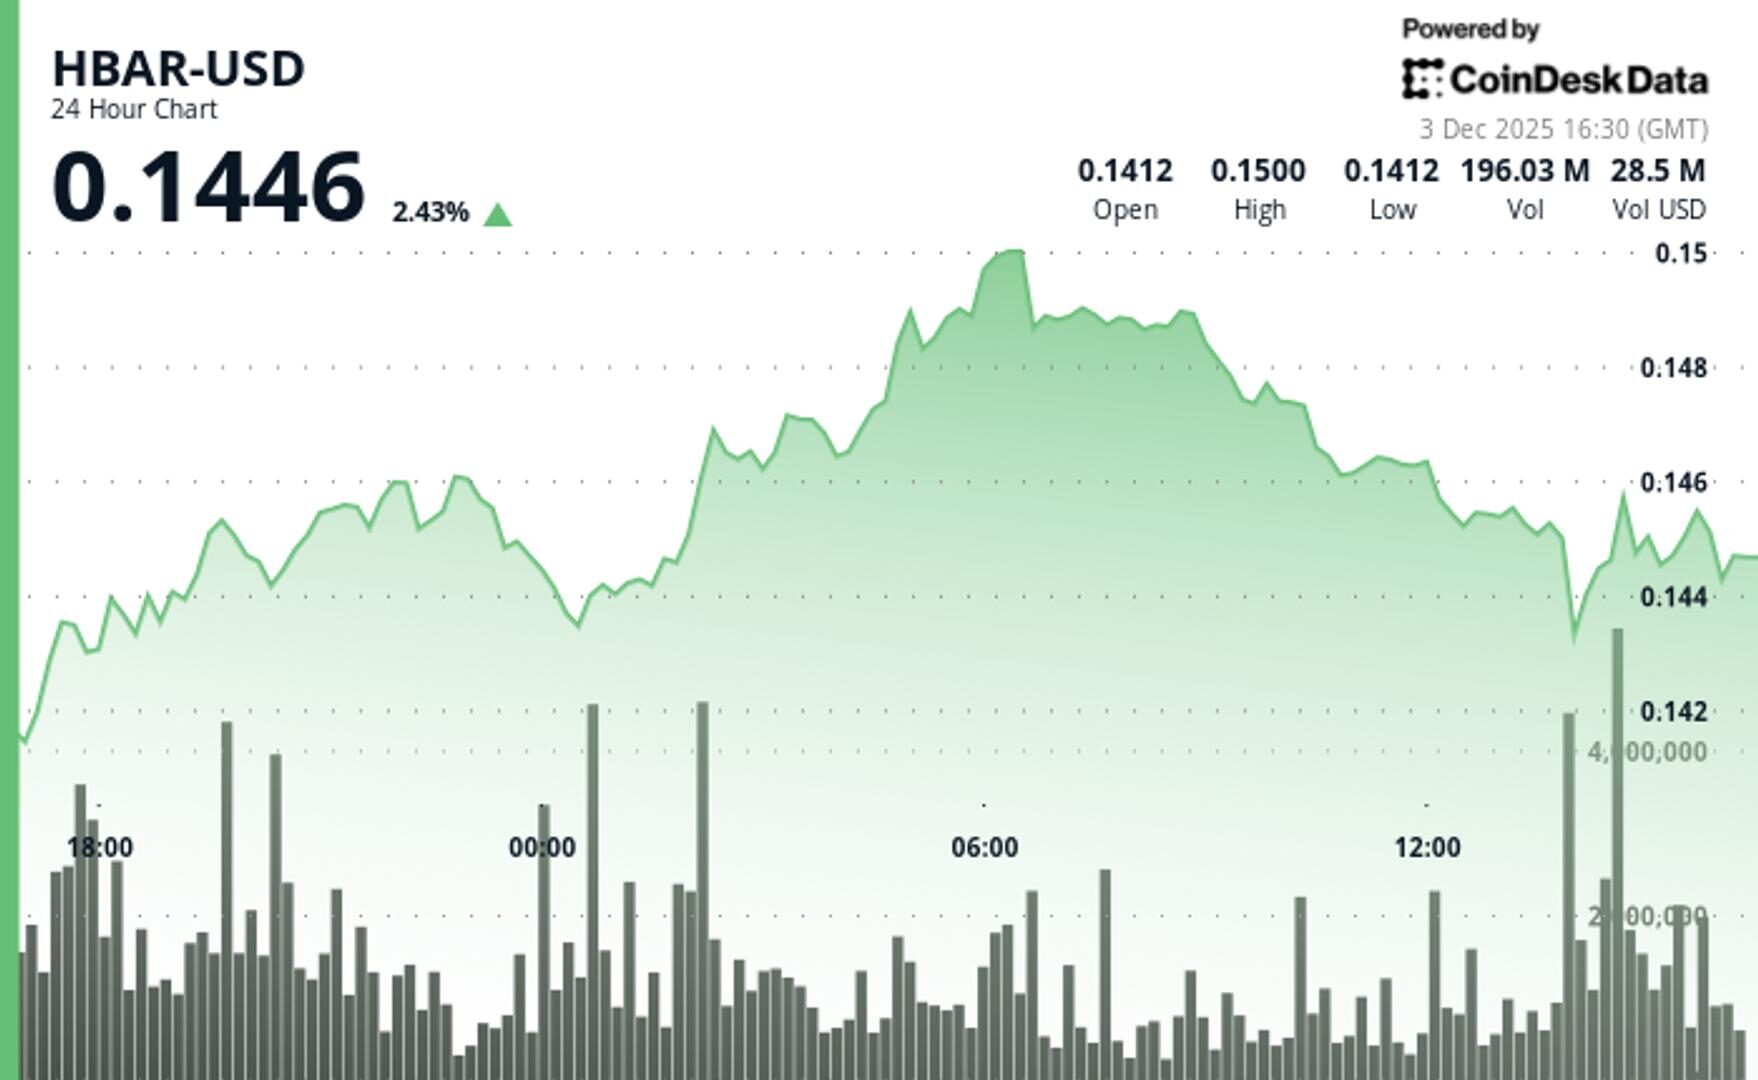
- HBAR climbs 1.70% to $0.14412 with volume surging 52.51% above seven-day average.
- Token tests resistance near $0.1467 before consolidating in ascending channel structure.
- Vanguard platform access for HBAR ETF and Georgia land registry adoption drive institutional interest.
HBAR edges higher during the 24 hour period, advancing from $0.1425 to $0.1453 while maintaining disciplined price action within an ascending channel structure.
The token demonstrates steady accumulation patterns rather than speculative momentum. The 52.51% volume increase above its seven-day moving average indicates genuine market participation.
STORY CONTINUES BELOW
The advance occurs alongside broader crypto market strength. HBAR shows minimal divergence from the CD5 index at just 0.25% relative difference.
Price action establishes a series of higher lows throughout the session. The most significant volume event occurs at 14:00 UTC when 165.32 million tokens trade—138% above the 24 hour simple moving average.
This volume spike accompanies a volatile rejection from resistance near $0.1467. HBAR finds solid support at $0.1427, validating the ascending trendline that originates from $0.1411.
With Canary Capital’s HBAR ETF becoming tradable through Vanguard’s brokerage interface, institutional access channels expand significantly while technical levels show measured consolidation.
The timing of this development coincides with HBAR’s test of key resistance. Price action remains primarily driven by technical factors rather than immediate news flow.
Georgia’s announcement regarding land registry migration to Hedera for real estate tokenization provides fundamental support for the technical advance. Although, it’s worth noting that HBAR remains at the mercy of the broader market and if bitcoin and ether begin to retrace Wednesday’s rally, pressure will be put on HBAR.

- Support/Resistance: Primary support establishes at $0.1427 with resistance cluster near $0.1467; ascending trendline from $0.1411 remains intact.
- Volume Analysis: 165.32 million token spike at resistance test (138% above SMA) follows sustained above-average activity confirming institutional participation.
- Chart Patterns: V-shaped recovery on 60-minute timeframe with breakout above $0.145; ascending channel structure maintains bullish bias with $0.0081 total range.
- Targets & Risk: Immediate upside target at $0.1467 resistance with extension toward $0.148; downside risk limited to $0.1427 support and ascending trendline confluence.
Disclaimer: Parts of this article were generated with the assistance from AI tools and reviewed by our editorial team to ensure accuracy and adherence to our standards. For more information, see CoinDesk’s full AI Policy.
More For You
Nov 14, 2025

What to know:
- As of October 2025, GoPlus has generated $4.7M in total revenue across its product lines. The GoPlus App is the primary revenue driver, contributing $2.5M (approx. 53%), followed by the SafeToken Protocol at $1.7M.
- GoPlus Intelligence’s Token Security API averaged 717 million monthly calls year-to-date in 2025 , with a peak of nearly 1 billion calls in February 2025. Total blockchain-level requests, including transaction simulations, averaged an additional 350 million per month.
- Since its January 2025 launch , the $GPS token has registered over $5B in total spot volume and $10B in derivatives volume in 2025. Monthly spot volume peaked in March 2025 at over $1.1B , while derivatives volume peaked the same month at over $4B.
More For You
By James Van Straten|Edited by Stephen Alpher
29 minutes ago

So-called “backwardation” — a futures price curve moving lower in value as time gets further out — can be read as a measure of stress in the market.
What to know:
- Backwardation signals that futures prices are now below near term levels, reflecting cautious forward pricing and weakened expectations among institutional traders.
- The structure often emerges during forced de-risking and has historically appeared near major or local bottoms.


-
Back to menu
-
Back to menu
Prices
-
Back to menu
-
Back to menu
Indices -
Back to menu
Research
-
Back to menu
Consensus 2026 -
Back to menu
Sponsored
-
Back to menu
-
Back to menu
Podcasts -
Back to menu
-
Back to menu
Webinars
Select Language