APT falls as token underperforms wider crypto markets
-
News
-
Video
-
Consensus 2026
-
Data & Indices
The token underperformed broader digital assets as trading activity remained subdued despite recent ecosystem developments.
By Will Canny, CD Analytics|Edited by Oliver Knight
Updated Dec 31, 2025, 1:32 p.m. Published Dec 31, 2025, 1:32 p.m.

- APT fell 2.4% over 24 hours.
- Technical indicators remained overwhelmingly bearish across all major moving averages.
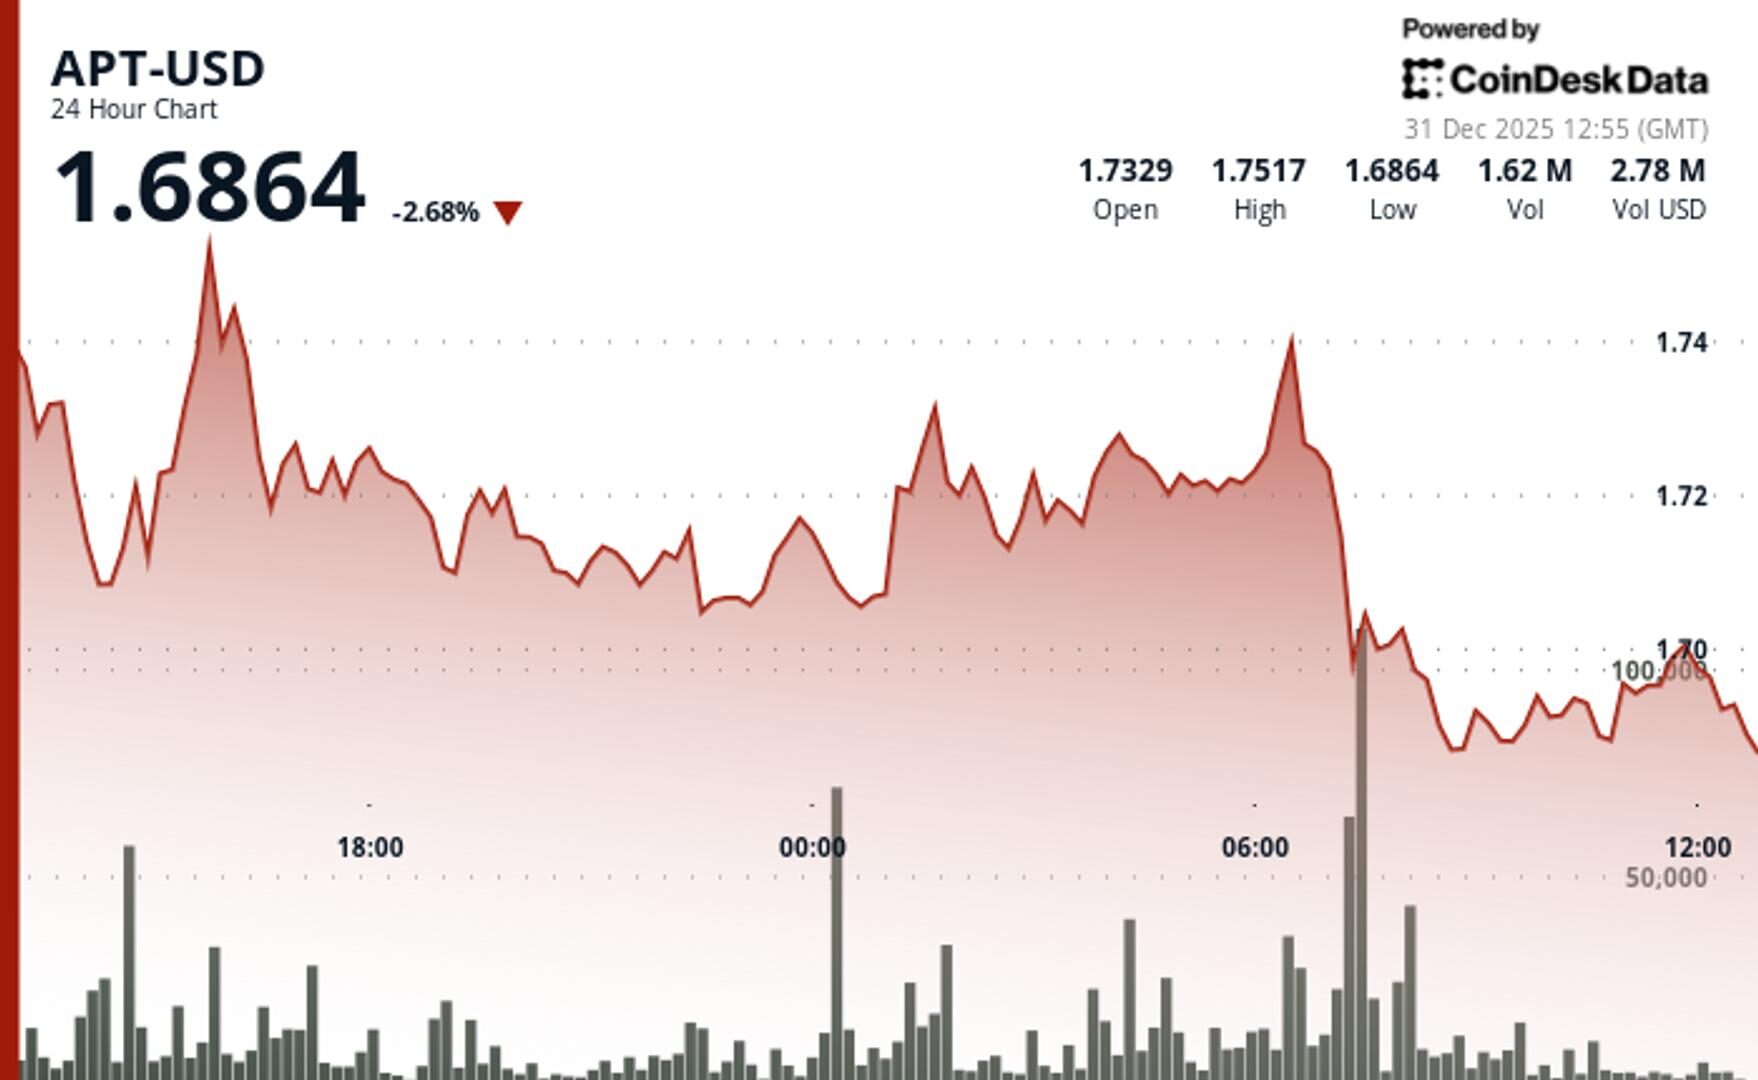
APT$1.6961 fell 2.4% to $1.69 on below-average volume, significantly underperforming the broader crypto market.
The broader market gauge, the CoinDesk 20 index (CD20), was 0.5% higher at publication time.
STORY CONTINUES BELOW
This relative weakness against major cryptocurrencies signals selective investor caution toward APT, according to CoinDesk Research’s technical analysis model.
The model showed that the token declined from $1.73 to $1.69 over the 24 hour period, establishing a volatile range-bound pattern with a total range of $0.09.
The most significant volume event occurred earlier this morning with exceptional volume of 12.2 million tokens, 214% above the 24 hour moving average, confirming strong resistance near $1.75, according to the model.
Price action showed consolidation within a tight channel following the initial decline, according to the model, with momentum decelerating as volume normalizes after the high-volume rejection.
APT’s decline comes on tepid trading activity, with 24 hour volume running 31% above its 7-day average but failing to reach significant threshold levels.
Technical Analysis:
- Primary support established at $1.68-$1.69 psychological level, with major resistance confirmed at $1.75 following high-volume rejection.
- Peak volume of 12.17 million (214% above SMA) confirms resistance failure, while recent recovery shows accelerating volume above $1.695 breakout level.
- Range-bound consolidation within $0.09 channel following initial decline, with 60-minute charts showing bullish recovery pattern.
- Immediate upside target at $1.70-$1.705 resistance cluster, with broader range highs near $1.75 representing next major test.
- Technical indicators showing overwhelming bearish signals across all timeframes.
Disclaimer: Parts of this article were generated with the assistance from AI tools and reviewed by our editorial team to ensure accuracy and adherence to our standards. For more information, see CoinDesk’s full AI Policy.
More For You
Dec 19, 2025

L1 tokens broadly underperformed in 2025 despite a backdrop of regulatory and institutional wins. Explore the key trends defining ten major blockchains below.
What to know:
2025 was defined by a stark divergence: structural progress collided with stagnant price action. Institutional milestones were reached and TVL increased across most major ecosystems, yet the majority of large-cap Layer-1 tokens finished the year with negative or flat returns.
This report analyzes the structural decoupling between network usage and token performance. We examine 10 major blockchain ecosystems, exploring protocol versus application revenues, key ecosystem narratives, mechanics driving institutional adoption, and the trends to watch as we head into 2026.
More For You
By Olivier Acuna|Edited by Sheldon Reback, Aoyon Ashraf
1 hour ago

The October flash crash exposed how fragile bitcoin’s rally had become. It also illustrated a fundamental change in how BTC is perceived.
What to know:
- Bitcoin’s 2025 bull run was disrupted by a flash crash, revealing the volatility and unpredictability of digital asset trading.
- Institutional acceptance has shifted bitcoin from a fringe asset to part of the institutional macro complex, affecting its price dynamics.
- Despite optimistic forecasts, bitcoin ended the year significantly below expectations, influenced by macroeconomic factors and cautious capital.


-
Back to menu
-
Back to menu
Prices
-
Back to menu
-
Back to menu
Indices -
Back to menu
Research
-
Back to menu
Consensus 2026 -
Back to menu
Sponsored
-
Back to menu
-
Back to menu
Podcasts -
Back to menu
-
Back to menu
Webinars
Select Language