Gold slips below 200-day moving average offering glimmer of hope for bitcoin bulls
Share this article
Gold falls into bear market territory, while a stronger U.S. dollar and rising rate expectations pressure risk assets.
By James Van Straten|Edited by Jamie Crawley
Jun 8, 2026, 9:57 a.m. 2 min read

- Gold has dropped more than 20% from its January record high of $5,600 per ounce and is now trading below its 200 day moving average.
- A stronger than expected US jobs report has increased expectations of a Federal Reserve rate hike, while the US Dollar Index (DXY) has moved back above 100.
- The Bitcoin-to-gold ratio, which measures how many ounces of gold one bitcoin can buy, has climbed 3% over the past 24 hours
Gold has fallen below its 200-day moving average (200DMA), a widely followed long term technical indicator that tracks the average closing price over the previous 200 trading days.
A break below the 200DMA is often interpreted as a sign that long term bullish momentum has weakened and that a broader trend reversal may be underway. This is the first time gold has traded below its 200DMA since October 2023, with prices now slipping beneath $4,300 per ounce.

The decline follows a huge rally in which gold surged nearly 200%, climbing from below $2,000 per ounce in October 2023 to a record high of $5,600 in January this year. Much of that advance was driven by the “debasement trade“, the investment thesis that government spending, rising debt levels, and loose monetary policy would erode the purchasing power of fiat currencies, increasing demand for scarce stores of value such as gold.
Gold has now entered bear market territory, having fallen more than 20% from its all time high. The latest weakness follows a stronger than expected U.S. jobs report on Friday, which prompted markets to price in a greater likelihood of Federal Reserve tightening. CME FedWatch Tool, now assigns a 25 basis point rate hike in December, which would lift the federal funds rate to a range of 3.75% to 4.00%.
Silver, which is often viewed as a higher beta version of gold due to its greater volatility, is currently testing support at its own 200DMA near $67 per ounce.
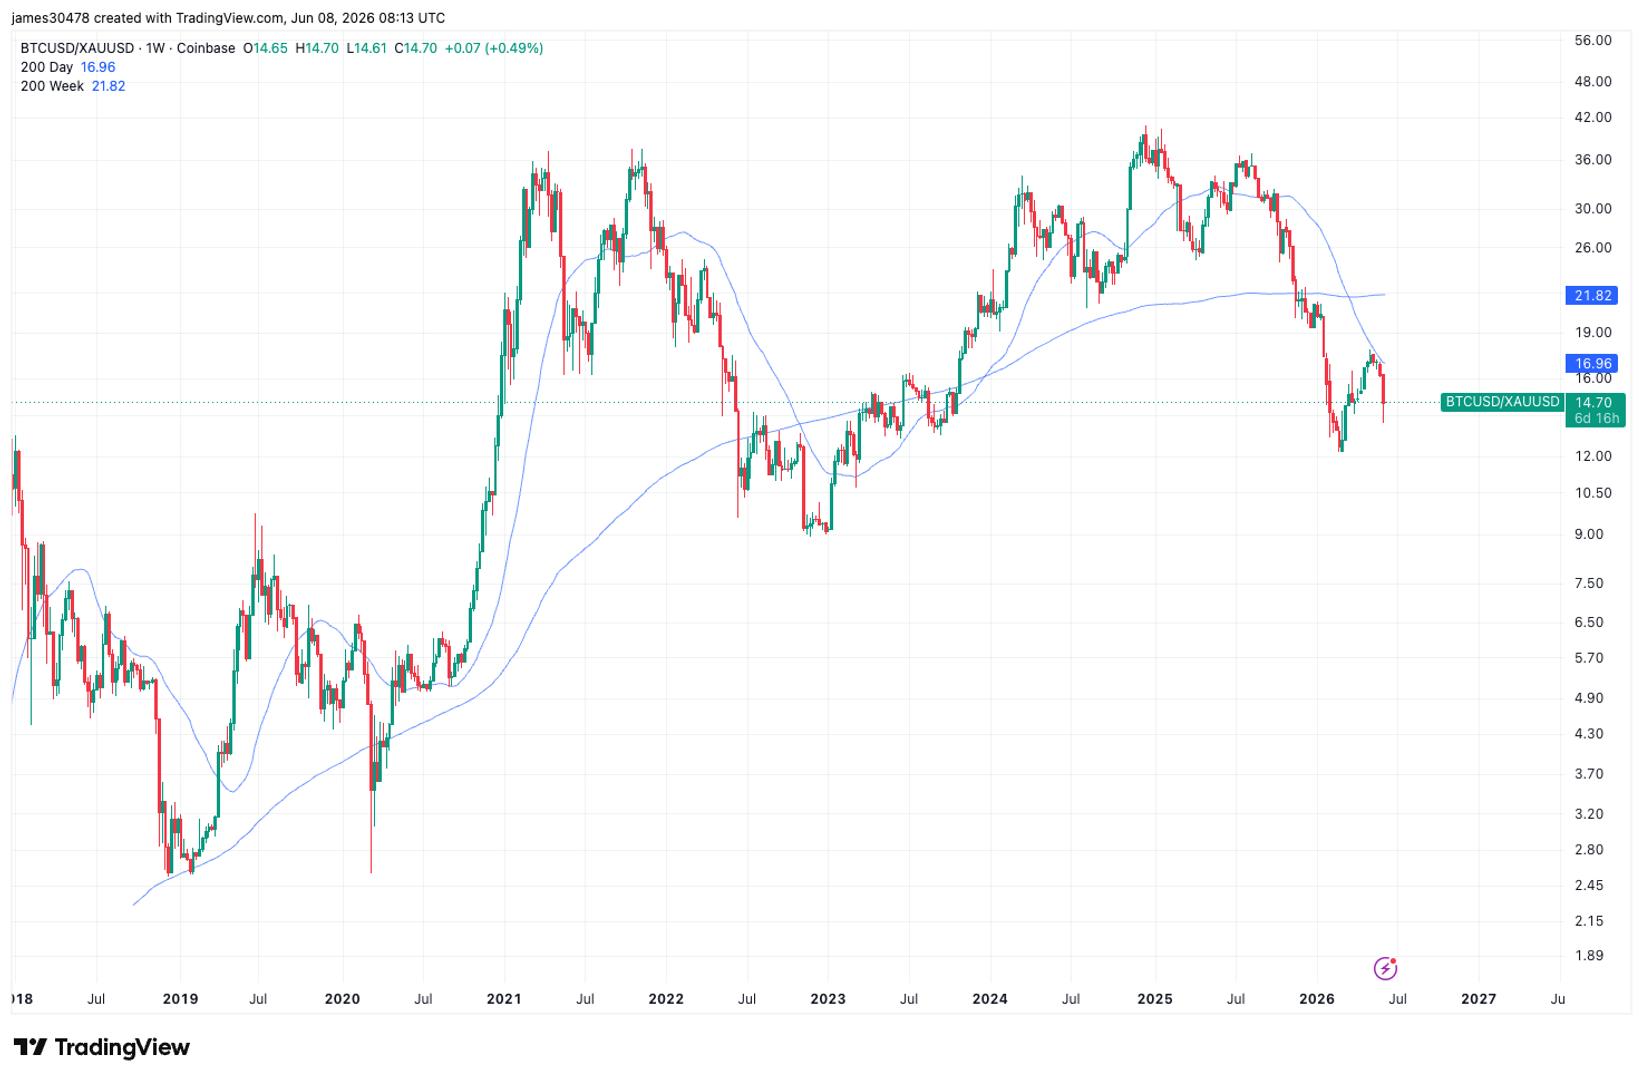
The bitcoin BTC$62,945.93 to gold ratio, which measures how many ounces of gold one bitcoin can purchase, has risen 3% over the past 24 hours to 14.72 ounces as bitcoin recovers toward $63,000.
Despite the rebound, the ratio remains roughly 70% below its December 2024 peak of approximately 41 ounces. Last month, the ratio was rejected at its 200DMA, which preceded bitcoin’s decline below $60,000. However, the ratio remains above its February lows, offering a modest sign of resilience for bitcoin bulls.
Adding further pressure to risk assets, the US Dollar Index (DXY) has climbed back above 100. A stronger dollar is typically a headwind for commodities, gold, and cryptocurrencies because it tightens global financial conditions, reduces liquidity, and makes dollar denominated assets more expensive for international investors.
More For You
By Jamie Crawley, AI Boost|Edited by Sheldon Reback
1 hour ago

Your look at what’s coming in the week starting June 8.
What to know:
Crypto Week Ahead is a comprehensive list of what’s coming up in the world of cryptocurrencies and blockchain, as well as the major macroeconomic events that will influence digital asset markets.


Top Stories


