
AI frenzy losing steam leaves BTC price less volatile than South Korea’s Kospi: Crypto Daily
By Omkar Godbole|Edited by Sheldon Reback
Jul 17, 2026, 11:48 a.m.
Share this article

Summary
While geopolitical tensions are pressuring bitcoin BTC$63,098.98 and the broader crypto market, a compelling data point has surfaced, highlighting the side effects of this year’s AI frenzy.
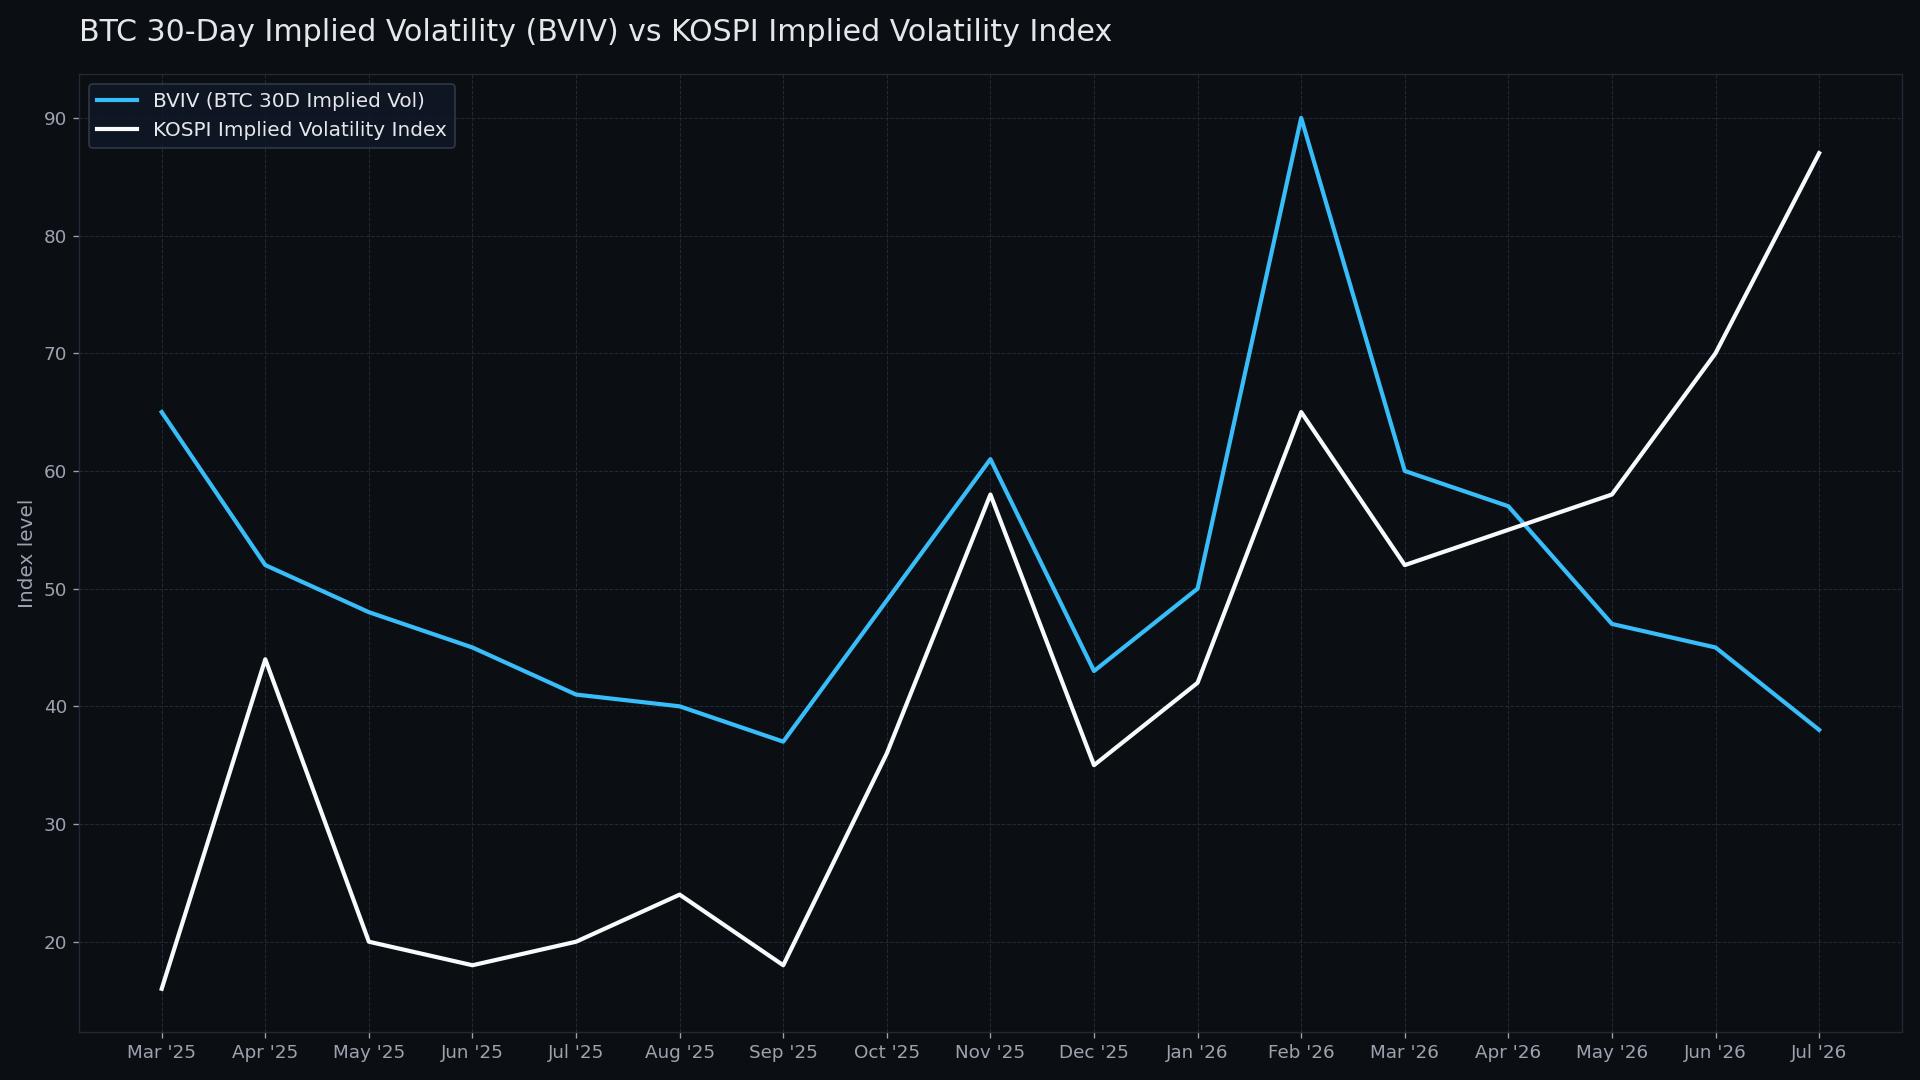
South Korea’s Kospi index, a primary beneficiary of the AI boom, has slumped nearly 25% in just four weeks. Options markets show the index is now viewed as at least twice as risky as bitcoin, a decentralized cryptocurrency frequently criticized for its extreme volatility.
Kospi’s options-based 30-day implied volatility (IV) index has surged to an annualized 81%, more than double BVIV, the bitcoin equivalent, at around 38%, data from Bloomberg and Volmex show. Implied volatility is determined by demand for options, or hedging contracts; greater demand indicates a greater perceived need for protection from price swings.
Many Korean retail traders chasing high returns through margin trading and leveraged ETFs have faced forced liquidations, now totaling more than $2 trillion in less than three months. The fact that a major economy’s stock index is exhibiting more volatility than bitcoin may serve as a warning to other global markets where the AI frenzy has fueled unprecedented risk-taking.
For bitcoin supporters, the reality that BTC is steadier than the Kospi is a notable victory. Still, the largest cryptocurrency remains twice as volatile and risky as the S&P 500 index, whose 30-day volatility index (VIX) sits below 20%. Perhaps the true milestone for bitcoin bulls will be the day when the VIX becomes more expensive than the BVIV.
In the meantime, bitcoin’s price remains under pressure, trading below its widely followed 50-day moving average, though there is a glimmer of optimism. According to analytics firm Nansen, the wallets that typically move first and in the largest size during geopolitical flare-ups have not meaningfully shifted into stablecoins.
“This is consistent with prior Middle East flare-ups: Short-term leveraged longs get flushed, and then accumulation resumes,” Nicolai Sondergaard, a research analyst at Nansen, said in an email.
Other market observers are urging a focus on the forthcoming hearings in Washington D.C.
“The Clarity Act faces what could be its final test today, the industry insisting its gets done while the bill snags on Trump conflict of interest provisions and fresh Senate hurdles before the August recess. This is the regulatory clarity the institutional bid has been waiting for,” analysts at Marex said.
Stay alert!
Read more: For analysis of today’s activity in altcoins and derivatives, see Crypto Markets Today . For a comprehensive list of events this week, see CoinDesk’s “Crypto Week Ahead.”
- Bitcoin under $63,000 after new U.S. strike on Iran. Trump’s China comment adds to uncertainty (CoinDesk): Bitcoin and Asian stocks fell Friday after U.S. airstrikes on Iran raised tensions in the Middle East. President Donald Trump’s allegations that China tampered with the 2020 U.S. election also hurt risk sentiment, sending the Australian dollar lower.
- Asian shares sink, with Tokyo down more than 5% as slumping AI stocks drag world markets lower (AP): World shares were mostly lower, with Tokyo’s Nikkei 225 index losing 4% as heavy selling pressure in computer-chip makers and AI-related shares dragged markets lower. S&P 500 index futures declined 0.8% while oil prices surged.
- Airbnb CEO says X account was hacked, attacker posted AI-slop on tokenization (CoinDesk): Airbnb CEO Brian Chesky said his X account was hacked, and the attacker posted a thread promoting tokenized real-world assets (RWAs) that was criticized as being heavily AI-assisted.
- DOG Mode vs. BIP-110: Inside the Bitcoin client built to bypass data restrictions (CoinDesk): Leonidas, a prominent figure in Bitcoin’s Ordinals and Runes ecosystem, said he is starting an open-source Bitcoin client called DOG Mode that would abolish two of the limits set by Bitcoin Core, the software that runs on the large majority of Bitcoin’s nodes.

The chart shows daily swings in the ether-bitcoin ratio, along with the 100-day and 200-day simple moving averages.
The ratio recently crossed above its 100-day average, marking a breakout above a technical line that has capped recovery rallies several times since January.
The 200-day average, however, remains a strong resistance level. Once it’s topped, that would mark a major green signal for sustained ether outperformance relative to bitcoin.
Related Assets

- 1
- 2
- 3
- 4
- 5
- 6
- 7
- 8
- 9
- 10


CEX trading volumes rose for the first time in five months in June, with spot climbing 15.3% to $1.11T and RWA perpetual volumes surging to a record $311B.
Jul 13, 2026
CEX trading volumes rose for the first time in five months in June, with spot climbing 15.3% to $1.11T and RWA perpetual volumes surging to a record $311B.
Why it matters:
CEX trading volumes rose for the first time in five months in June, with spot climbing 15.3% to $1.11T and RWA perpetual volumes surging to a record $311B.