BTC
$106,095.29
+
2.22%
ETH
$2,445.50
+
4.38%
USDT
$1.0004
–
0.02%
XRP
$2.2113
+
5.62%
BNB
$644.13
+
1.73%
SOL
$145.14
+
2.95%
USDC
$0.9998
–
0.01%
TRX
$0.2745
+
0.84%
DOGE
$0.1652
+
3.98%
ADA
$0.5876
+
3.95%
HYPE
$37.42
+
1.85%
WBT
$47.99
+
0.43%
SUI
$2.7984
+
3.50%
LINK
$13.39
+
8.08%
BCH
$455.10
–
0.01%
LEO
$8.9788
–
0.91%
XLM
$0.2485
+
4.14%
AVAX
$18.19
+
4.55%
TON
$2.9012
+
1.09%
SHIB
$0.0₄1166
+
3.21%
By Siamak Masnavi, CD Analytics|Edited by Aoyon Ashraf
Jun 24, 2025, 7:09 p.m.

- BCH was rejected three times at the $467 resistance level following a high-volume surge.
- Strong buyer interest emerged near $450, helping form a short-term support zone.
- Volatility increased in the final hour as BCH formed a V-pattern recovery with rising volume.
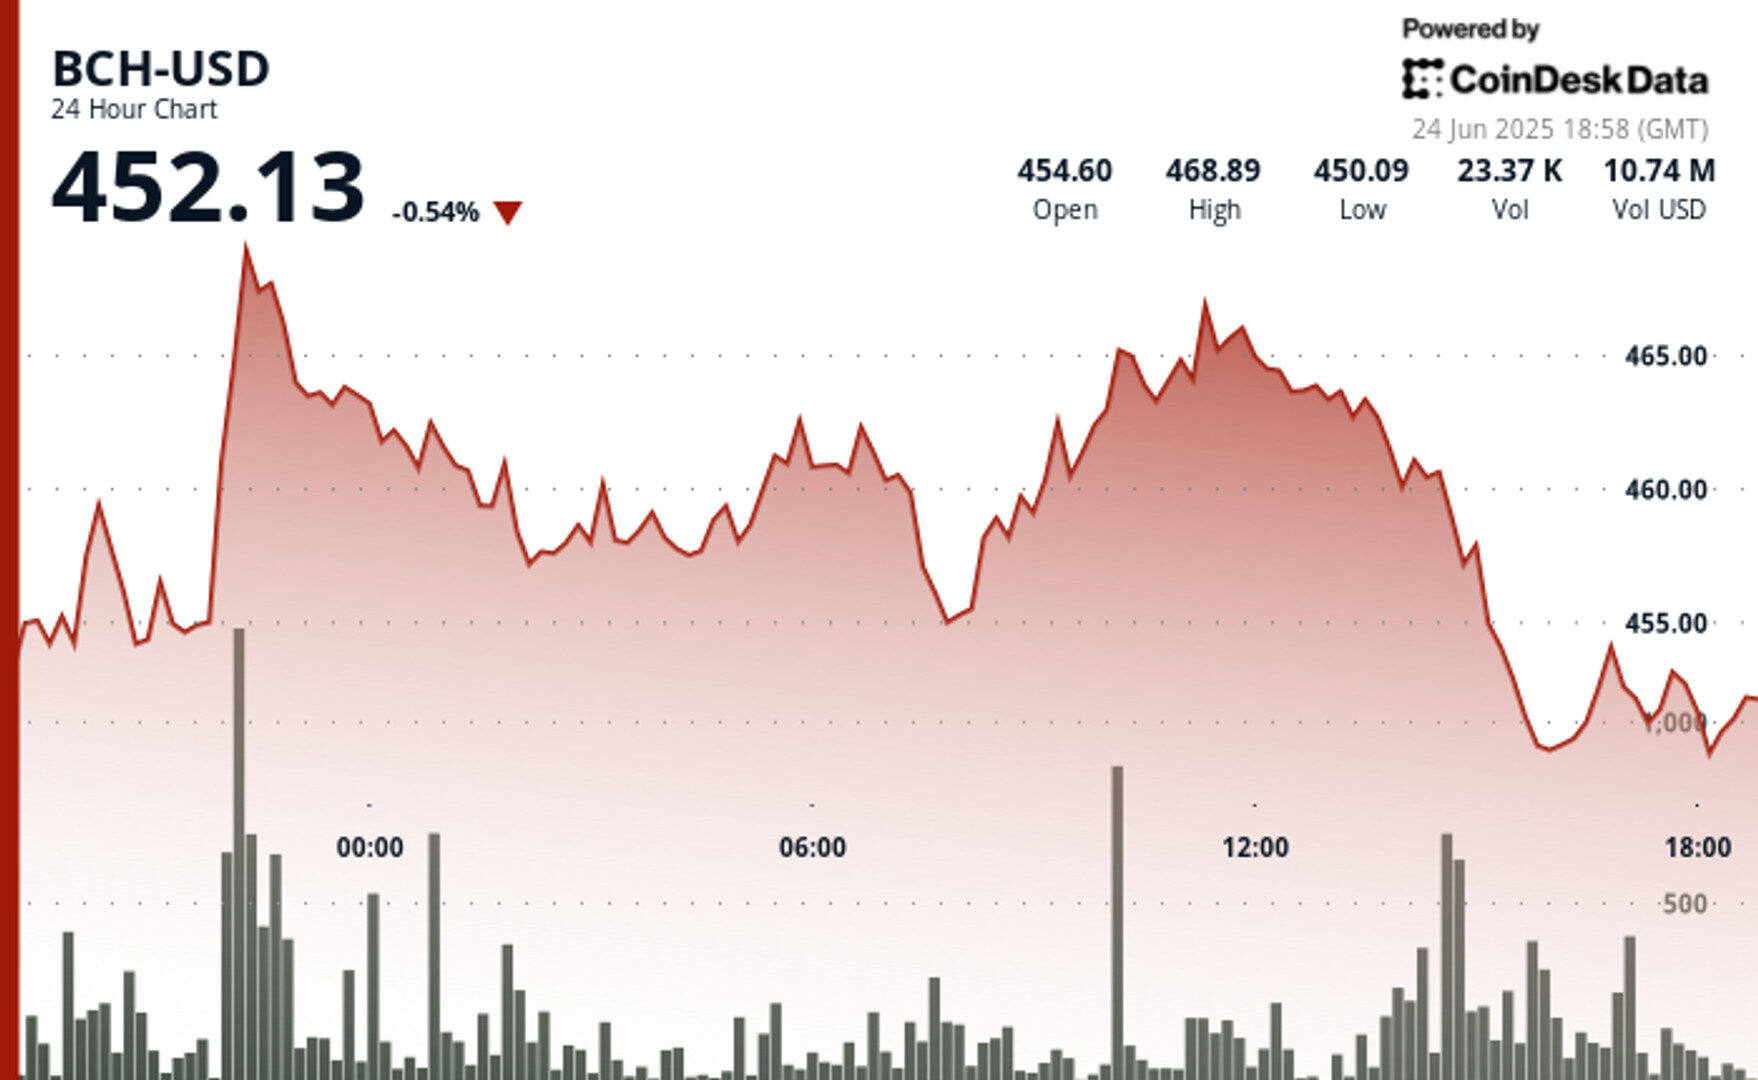
Bitcoin Cash (BCH)
is trading at $452.13, down 0.54% over the past 24 hours, after failing to breach the $467 resistance level across multiple tests, according to CoinDesk Research’s technical analysis model.
The token briefly surged near that level late on June 23, gaining nearly 3% during a high-volume spike, but was subsequently rejected twice more, reinforcing the significance of that barrier. A descending trendline formed during the corrective pullback, with lower highs establishing a bearish short-term tone.
STORY CONTINUES BELOW
On the regulatory front, Federal Reserve Chair Jerome Powell announced that U.S. banks now have the freedom to determine their digital asset customer base without prior regulatory pre-approval. This policy shift effectively removes institutional adoption barriers and is considered a meaningful step toward greater integration of crypto within the traditional financial system.
Technical Analysis Highlights
- BCH traded in a $19.76 range (4.4%) from $449.61 to $469.63 over 24 hours.
- At 22:00 on June 23, BCH surged nearly 3% on 79,485 volume units, setting resistance at $467.
- The $467 level was tested and rejected two more times, confirming strong overhead resistance.
- Support formed around $450 with significant volume accumulation between 15:00–16:00.
- A descending trendline of lower highs emerged following the initial spike, signaling bearish momentum.
- A V-shaped micro-trend formed during the final hour, with a bounce from $449.94 to $451.31.
- Volume spiked during the 18:17–18:19 drop and again on the 18:30–18:32 recovery.
- A short-term support zone developed near $450 after repeated successful retests.
Disclaimer: Parts of this article were generated with the assistance from AI tools and reviewed by our editorial team to ensure accuracy and adherence to our standards. For more information, see CoinDesk’s full AI Policy.
Siamak Masnavi is a researcher specializing in blockchain technology, cryptocurrency regulations, and macroeconomic trends shaping the crypto market. He holds a PhD in computer science from the University of London and began his career in software development, including four years in the banking industry in the City of London and Zurich. In April 2018, Siamak transitioned to writing about cryptocurrency news, focusing on journalism until January 2025, when he shifted exclusively to research on the aforementioned topics.

CoinDesk Analytics is CoinDesk’s AI-powered tool that, with the help of human reporters, generates market data analysis, price movement reports, and financial content focused on cryptocurrency and blockchain markets.
All content produced by CoinDesk Analytics is undergoes human editing by CoinDesk’s editorial team before publication. The tool synthesizes market data and information from CoinDesk Data and other sources to create timely market reports, with all external sources clearly attributed within each article.
CoinDesk Analytics operates under CoinDesk’s AI content guidelines, which prioritize accuracy, transparency, and editorial oversight. Learn more about CoinDesk’s approach to AI-generated content in our AI policy.


