-
Back to menu
Prices
-
Back to menu
-
Back to menu
Indices -
Back to menu
Research
-
Back to menu
Events -
Back to menu
Sponsored
-
Back to menu
Videos -
Back to menu
-
Back to menu
-
Back to menu
Webinars
Select Language
By CD Analytics, Will Canny|Edited by Stephen Alpher
Aug 7, 2025, 3:03 p.m.

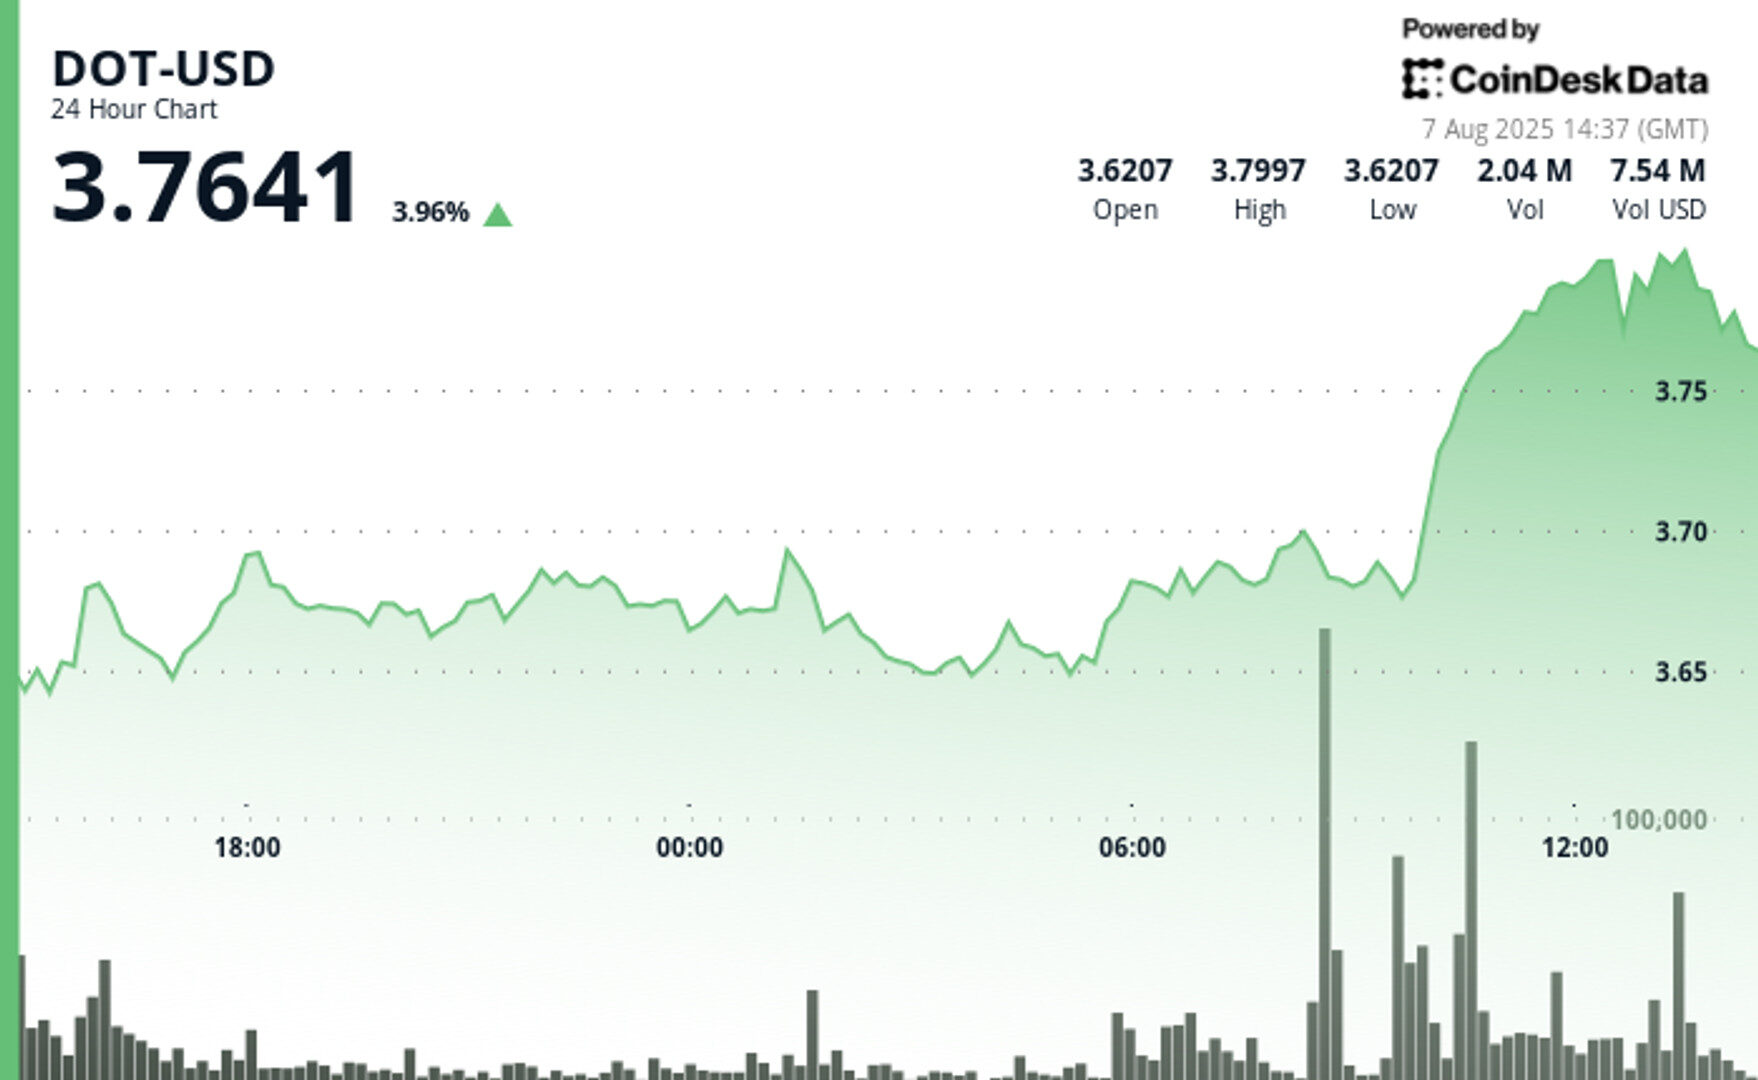
- Polkadot rallied 4% amidst broader gains in crypto markets.
- Support has formed at $3.68 with resistance at $3.80
Polkadot’s DOT rose as much as 4% in the last 24 hours, climbing from $3.65 to $3.80 on institutional buying, according to CoinDesk Research’s technical analysis model.
The model showed that the breakout accelerated between 10:00-11:00 GMT as price rose from $3.68 to $3.79.

STORY CONTINUES BELOW
Volume spiked to 5.29 million units, nearly 3x the daily average of 1.83 million, confirming strong accumulation at $3.68 support, according to the model.
Resistance caps gains at $3.80 as profit-taking emerges on elevated volume.
The staking rate on Polkadot has slipped to 49.17% over the last week.
The rally in Polkadot came as the wider crypto market also rose, with the broader market gauge, the Coindesk 20, recently up 3.7%.
In recent trading, DOT was 3% higher over 24 hours, trading around $3.76.
- Institutional distribution at higher levels confirms breakdown of previous bullish structure from 24-hour surge.
- Strong high-volume support established at $3.68 level with exceptional volume confirmation.
- Key resistance emerges at $3.80 where price reverses on elevated volume.
- Sustained upward momentum with consistently higher lows signals continued bullish sentiment.
Disclaimer: Parts of this article were generated with the assistance from AI tools and reviewed by our editorial team to ensure accuracy and adherence to our standards. For more information, see CoinDesk’s full AI Policy.
CoinDesk Analytics is CoinDesk’s AI-powered tool that, with the help of human reporters, generates market data analysis, price movement reports, and financial content focused on cryptocurrency and blockchain markets.
All content produced by CoinDesk Analytics is undergoes human editing by CoinDesk’s editorial team before publication. The tool synthesizes market data and information from CoinDesk Data and other sources to create timely market reports, with all external sources clearly attributed within each article.
CoinDesk Analytics operates under CoinDesk’s AI content guidelines, which prioritize accuracy, transparency, and editorial oversight. Learn more about CoinDesk’s approach to AI-generated content in our AI policy.

Will Canny is an experienced market reporter with a demonstrated history of working in the financial services industry. He’s now covering the crypto beat as a finance reporter at CoinDesk. He owns more than $1,000 of SOL.

More For You
By CD Analytics, Francisco Rodrigues|Edited by Aoyon Ashraf
54 minutes ago

The recent price rally is likely tied to a broader market trend, with growing expectations of a Federal Reserve interest rate cut in September.
What to know:
- PEPE has risen over 5% in the last 24 hours, driven by a high-volume breakout that helped the token surge above a recent resistance level.
- Despite a 73% drop in trading volume across PEPE derivatives contracts since mid-July, the 100 largest Ethereum addresses have increased their holdings by 2.36% over the past 30 days.
- The recent price rally is likely tied to a broader market trend, with growing expectations of a Federal Reserve interest rate cut in September.


