-
Back to menu
Prices
-
Back to menu
-
Back to menu
Indices -
Back to menu
Research
-
Back to menu
Events -
Back to menu
Sponsored
-
Back to menu
Videos -
Back to menu
-
Back to menu
-
Back to menu
Webinars
Select Language
By CD Analytics, Oliver Knight
Updated Aug 12, 2025, 4:22 p.m. Published Aug 12, 2025, 4:22 p.m.

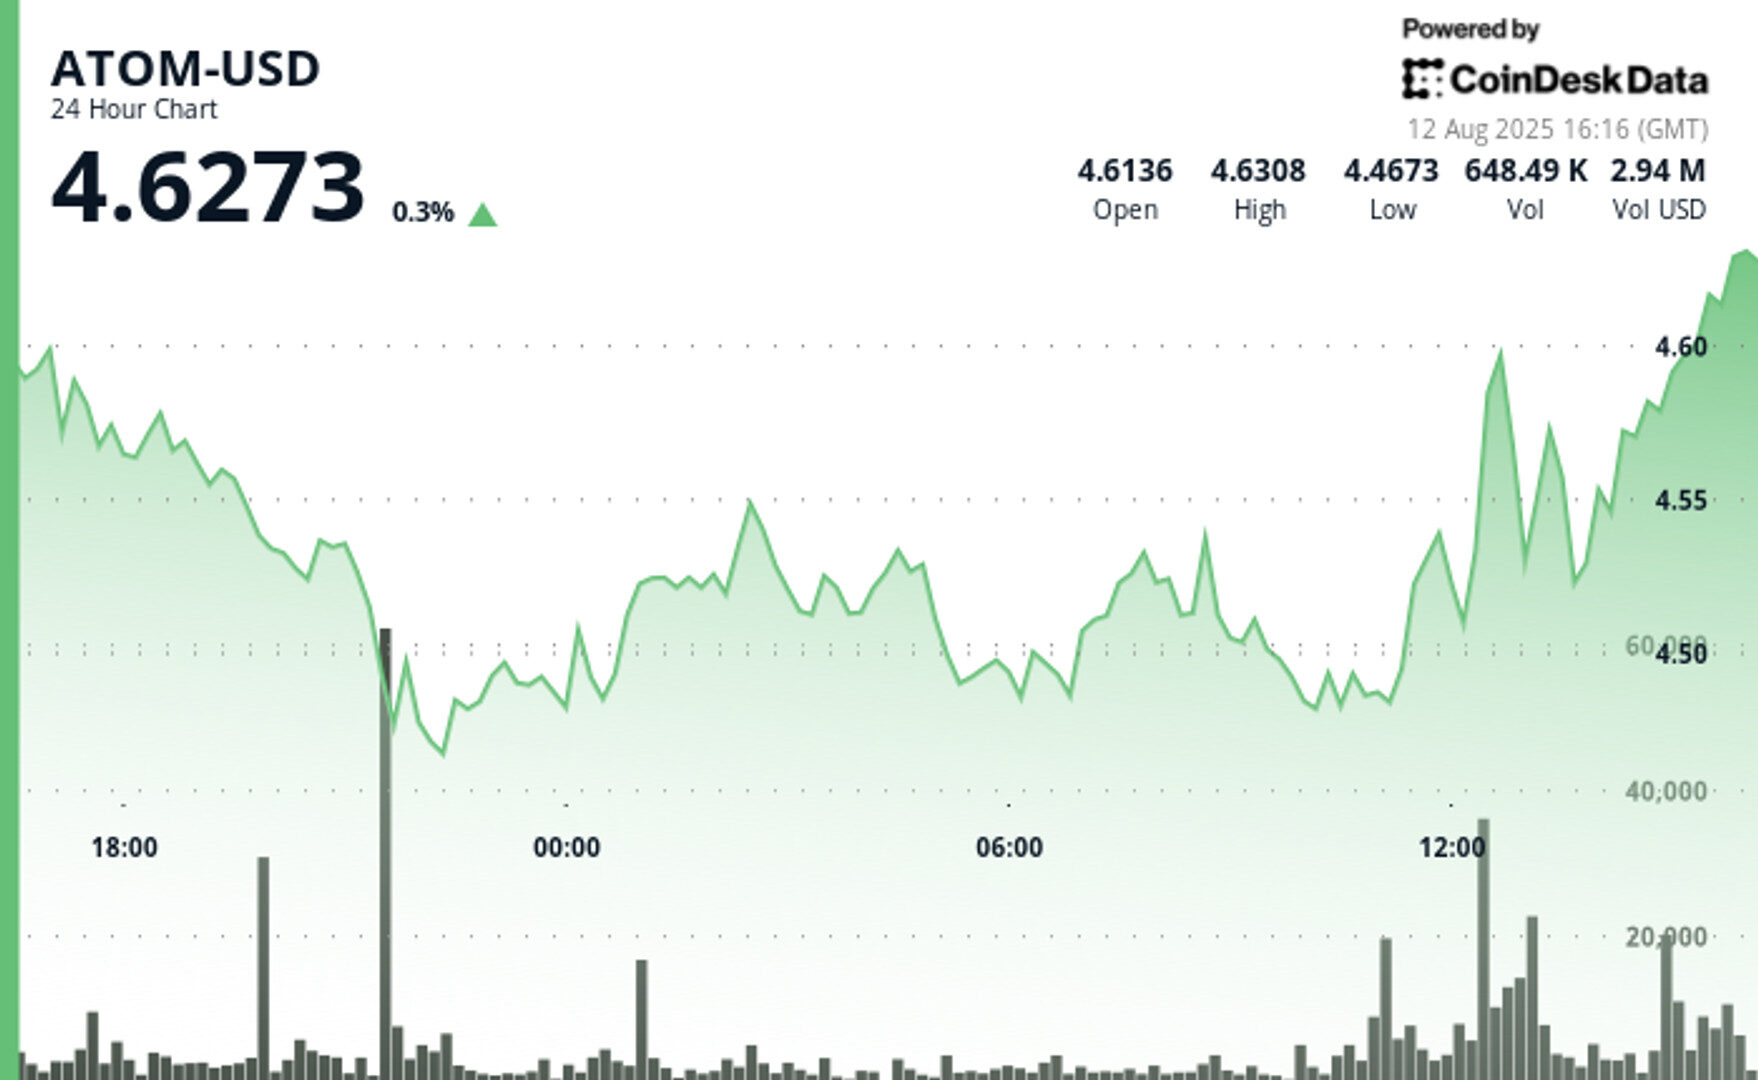
- ATOM traded within a tight $0.18 range, with $4.60 marking strong institutional resistance and $4.47–$4.48 acting as a firm support zone.
- Institutional buying surged Aug. 12, with volumes hitting 1.93 million tokens during the recovery phase.
- Final-hour selloff saw ATOM drop 1% from $4.57 to $4.51 as sellers broke through multiple support levels.
ATOM traded in a tight range over the past 24 hours, with price action dominated by institutional flows. Between Aug. 11 at 15:00 and Aug. 12 at 14:00, the token swung 4% between $4.65 and $4.47. Heavy selling from $4.65 to $4.45 on Aug. 11 gave way to strong buying the following morning, with volumes spiking to 1.93 million tokens. Resistance formed at $4.60, while repeated bounces from $4.47–$4.48 highlighted a firm support zone.
The Cosmos ecosystem also got a boost from Coinbase’s listing of dYdX (COSMOSDYDX), which jumped from $0.59 to $0.63 on the news. ATOM’s recent price behavior fits an accumulation pattern between $4.47 and $4.60, with strategists eyeing potential upside to $5.48 by 2025 as institutional adoption grows.

STORY CONTINUES BELOW
The final hour of trading saw renewed volatility, with ATOM sliding 1% from $4.57 to $4.51 in 22 minutes as sellers overpowered support at $4.55 and $4.53. Elevated volumes during the drop confirmed profit-taking and repositioning, underscoring a consolidation phase with clear institutional boundaries on both sides.

- Overall institutional trading range of $0.18 representing 4% spread between maximum of $4.65 and minimum of $4.47.
- Pronounced institutional selling from August 11 at 16:00 through 22:00, declining from $4.65 to $4.45.
- Exceptional institutional trading volume of 1,927,633 units during August 12 11:00-12:00 recovery phase.
- Key institutional resistance level established at $4.60 where profit-taking occurred on strong volume.
- Institutional support zone materialized around $4.47-$4.48 with multiple successful accumulation phases.
- Clear institutional resistance at $4.57 level with intensified selling pressure during final trading hour.
- Accelerated institutional repositioning through support levels at $4.55 and $4.53.
- Modest institutional recovery attempt from $4.51 support establishing consolidation range $4.52-$4.53.
Disclaimer: Parts of this article were generated with the assistance from AI tools and reviewed by our editorial team to ensure accuracy and adherence to our standards. For more information, see CoinDesk’s full AI Policy.
CoinDesk Analytics is CoinDesk’s AI-powered tool that, with the help of human reporters, generates market data analysis, price movement reports, and financial content focused on cryptocurrency and blockchain markets.
All content produced by CoinDesk Analytics is undergoes human editing by CoinDesk’s editorial team before publication. The tool synthesizes market data and information from CoinDesk Data and other sources to create timely market reports, with all external sources clearly attributed within each article.
CoinDesk Analytics operates under CoinDesk’s AI content guidelines, which prioritize accuracy, transparency, and editorial oversight. Learn more about CoinDesk’s approach to AI-generated content in our AI policy.

Oliver Knight is the co-leader of CoinDesk data tokens and data team. Before joining CoinDesk in 2022 Oliver spent three years as the chief reporter at Coin Rivet. He first started investing in bitcoin in 2013 and spent a period of his career working at a market making firm in the UK. He does not currently have any crypto holdings.

More For You
By CD Analytics, Will Canny|Edited by Aoyon Ashraf
38 minutes ago

Successful defence of the $3.88-$3.92 consolidation range suggests the potential for further appreciation toward the $4.15-$4.20 Fibonacci extension targets.
What to know:
- DOT gained 4% after defending support.
- The token may now target the $4.15-$4.20 zone.


