-
Back to menu
Prices
-
Back to menu
-
Back to menu
Indices -
Back to menu
Research
-
Back to menu
Events -
Back to menu
Sponsored
-
Back to menu
Videos -
Back to menu
-
Back to menu
-
Back to menu
Webinars
Select Language
By CD Analytics, Oliver Knight
Updated Aug 12, 2025, 4:13 p.m. Published Aug 12, 2025, 4:13 p.m.

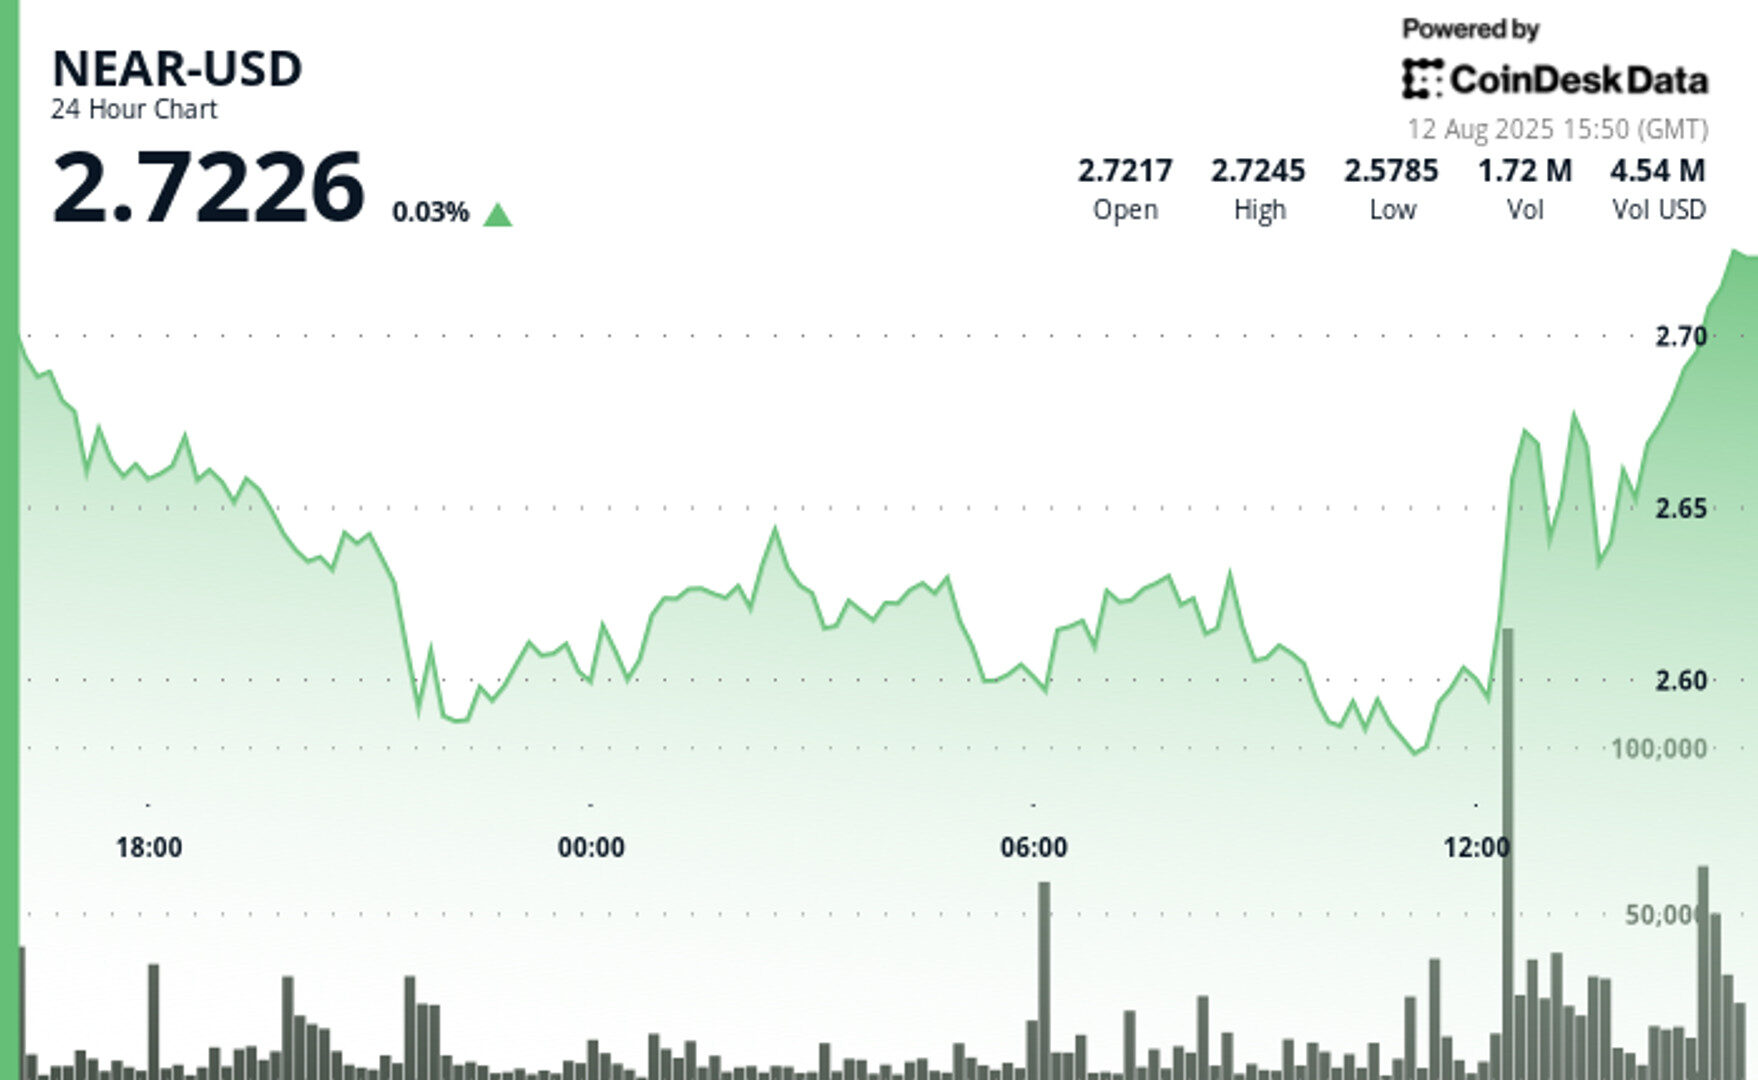
- NEAR spiked to $2.678 on Aug. 12 before a rapid sell-off erased most gains, with $2.675–$2.680 acting as strong resistance and $2.630–$2.635 holding as key support.
- The token rebounded from $2.57 to $2.73 in a 6% range, supported by heavy volume and repeated defenses of the $2.57–$2.59 support zone.
- $572M in global digital asset inflows—including $10.1M for NEAR—combined with U.S. 401(k) crypto policy changes bolstered sentiment, though resistance near $2.73 remains a barrier.
NEAR Protocol saw sharp intraday swings on Aug. 12, with prices climbing from $2.643 to $2.678 by 13:35 before reversing swiftly. The sell-off, concentrated between 13:38 and 13:49, erased most hourly gains as the token fell to $2.634 on heavy volume exceeding 200,000 tokens per minute. Profit-taking at the $2.675–$2.680 resistance level—identified in prior sessions—capped the rally, while the $2.630–$2.635 zone once again provided firm support. NEAR closed the hour at $2.644 after a low-volume rebound attempt.
Over the prior 24 hours, NEAR rebounded strongly from $2.57 support to touch $2.73, a 6% range that showcased aggressive buying interest. The move followed an initial dip from $2.68 to $2.58 before buyers regained control, sending prices back to $2.68 with exceptional turnover of 8.01 million tokens. Resistance around $2.68–$2.73 remains intact, with $2.57–$2.59 proving a reliable floor during repeated tests.

STORY CONTINUES BELOW
Institutional demand underpinned the rally, with $572 million in global inflows into digital asset investment products last week, including $10.1 million directed toward NEAR. The momentum came as U.S. policy shifts allowed digital assets in 401(k) retirement plans, sparking $1.57 billion in late-week inflows and boosting confidence across blockchain markets. Analysts view this as a pivotal moment for mainstream adoption, potentially broadening NEAR’s investor base.
Technically, NEAR’s chart shows a resilient recovery pattern supported by high-volume surges at key levels. Strong buying near $2.57–$2.59 repeatedly sparked sharp reversals, while the upper $2.68–$2.73 band continues to draw heavy selling pressure. With institutional flows accelerating and regulatory developments favoring crypto adoption, NEAR’s price action may remain volatile but underpinned by strengthening long-term support.

Technical indicators
- High-volume surge exceeding the 24-hour average of 2.73 million establishes formidable resistance around $2.68-$2.73.
- The $2.57-$2.59 zone has proven remarkably robust as support through multiple successful examinations and volume-backed reversals.
- The most significant bearish pressure materialized between 13:38 and 13:49, wherein NEAR plummeted from $2.67 to $2.63, effectively erasing virtually all hourly gains within an 11-minute timeframe accompanied by exceptionally elevated selling volume exceeding 200,000 tokens per minute.
- This volatile configuration suggests profit-taking activities at the $2.68-$2.68 resistance zone established during the antecedent 24-hour analysis.
- The $2.63-$2.64 level continues to furnish critical support, with the session concluding at $2.64 following a modest recovery attempt that lacked sufficient volume conviction.
Disclaimer: Parts of this article were generated with the assistance from AI tools and reviewed by our editorial team to ensure accuracy and adherence to our standards. For more information, see CoinDesk’s full AI Policy.
CoinDesk Analytics is CoinDesk’s AI-powered tool that, with the help of human reporters, generates market data analysis, price movement reports, and financial content focused on cryptocurrency and blockchain markets.
All content produced by CoinDesk Analytics is undergoes human editing by CoinDesk’s editorial team before publication. The tool synthesizes market data and information from CoinDesk Data and other sources to create timely market reports, with all external sources clearly attributed within each article.
CoinDesk Analytics operates under CoinDesk’s AI content guidelines, which prioritize accuracy, transparency, and editorial oversight. Learn more about CoinDesk’s approach to AI-generated content in our AI policy.

Oliver Knight is the co-leader of CoinDesk data tokens and data team. Before joining CoinDesk in 2022 Oliver spent three years as the chief reporter at Coin Rivet. He first started investing in bitcoin in 2013 and spent a period of his career working at a market making firm in the UK. He does not currently have any crypto holdings.

More For You
By CD Analytics, Will Canny|Edited by Aoyon Ashraf
38 minutes ago

Successful defence of the $3.88-$3.92 consolidation range suggests the potential for further appreciation toward the $4.15-$4.20 Fibonacci extension targets.
What to know:
- DOT gained 4% after defending support.
- The token may now target the $4.15-$4.20 zone.


