-
Back to menu
Prices
-
Back to menu
-
Back to menu
Indices -
Back to menu
Research
-
Back to menu
Events -
Back to menu
Sponsored
-
Back to menu
Videos -
Back to menu
-
Back to menu
-
Back to menu
Webinars
Select Language
By CD Analytics, Oliver Knight
Updated Aug 20, 2025, 3:50 p.m. Published Aug 20, 2025, 3:50 p.m.

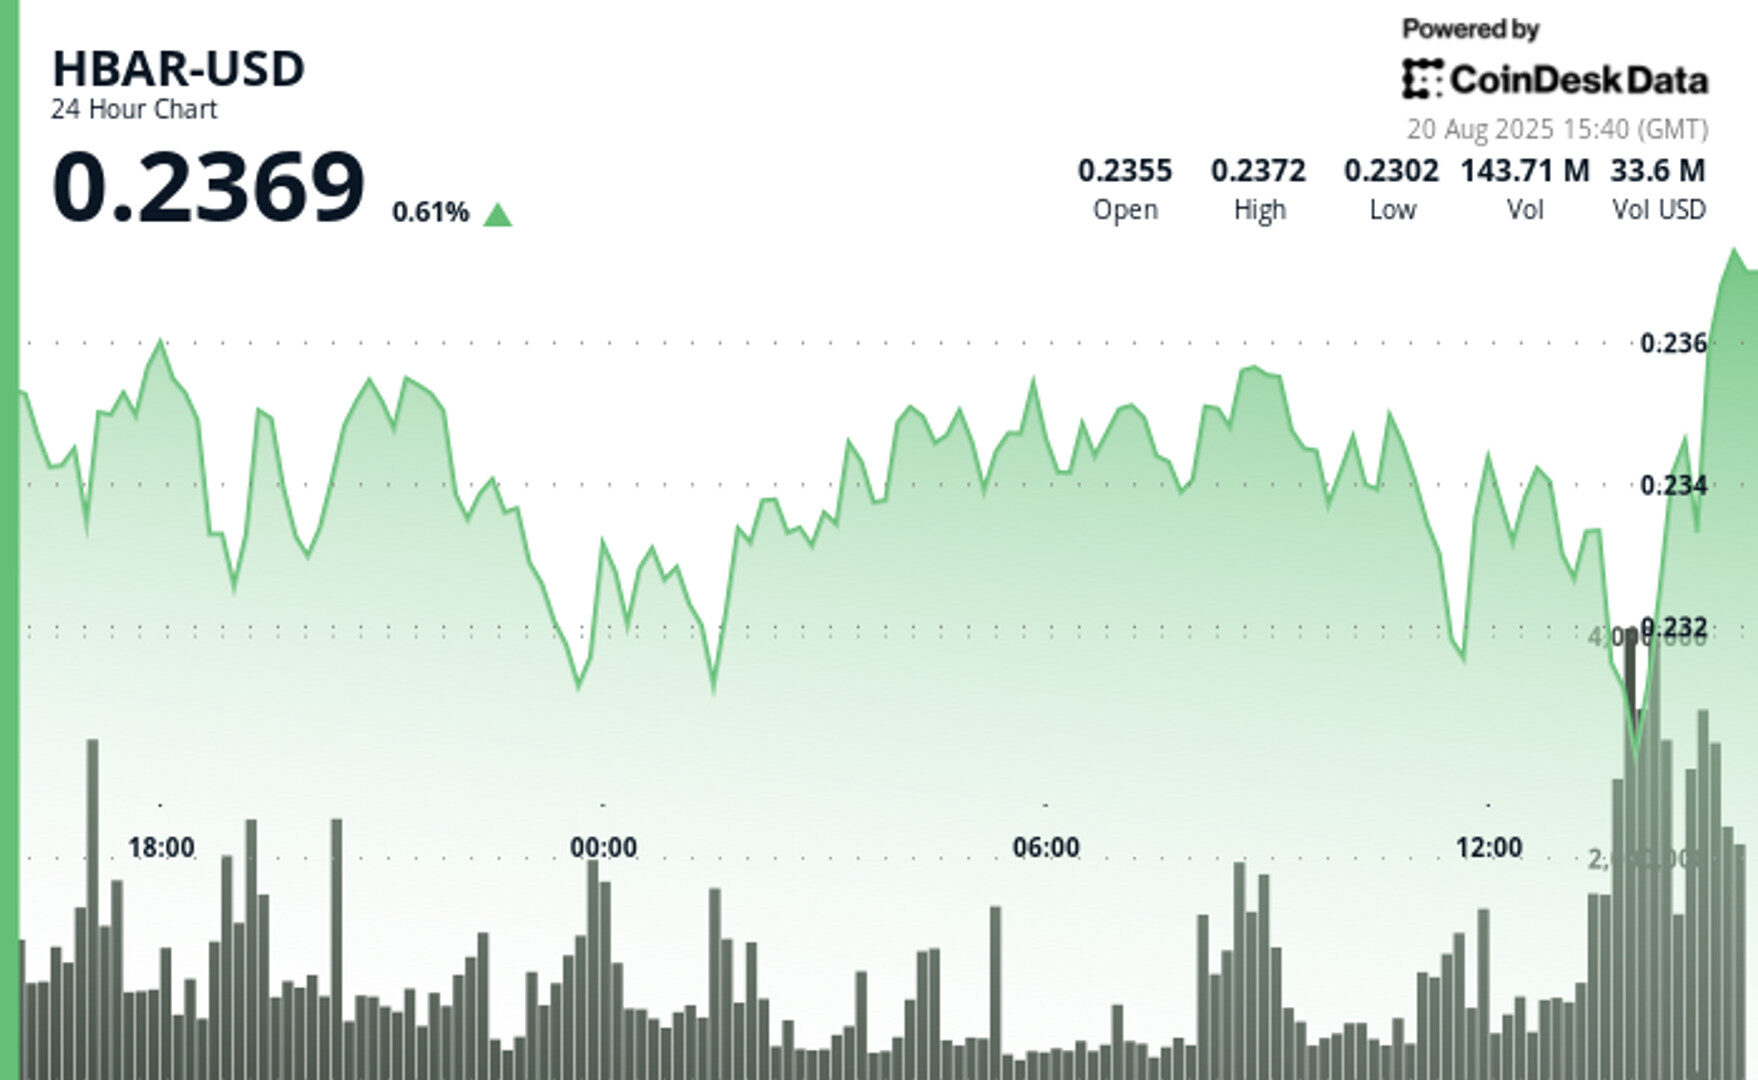
- HBAR slid 3% from $0.24 to $0.23 over a 23-hour period between August 19–20, trading within a narrow $0.01 range.
- Heavy selling pressure during the final hour pushed volumes to 85.82 million, marking the most active stretch of the session.
- Support held at $0.23, with a late recovery suggesting buyers are defending near-term levels despite broader volatility.
Hedera Hashgraph’s HBAR token faced heavy selling pressure during a volatile 23-hour stretch between August 19 at 15:00 and August 20 at 14:00, sliding 3% from $0.24 to $0.23.
The token traded within a tight $0.01 band, marking a 4% spread between its session high and low, as traders adjusted exposure across alternative digital assets. Analysts highlighted the $0.24 level as a key point of resistance, where buying momentum faded and downward pressure intensified.
STORY CONTINUES BELOW
The most pronounced activity came during the final hour of trading on August 20, when volumes surged to 85.82 million HBAR.
Market observers noted that the token tumbled to $0.23 before staging a modest recovery into the close, a pattern that underscored the elevated volatility. The heavy turnover during this window suggests sellers were dominant, creating short-term weakness and testing key support levels.
Between 13:45 and 14:06, more than 3.8 million tokens changed hands, coinciding with the sharpest part of the decline. Prices briefly dipped to session lows before bouncing, as buying interest re-emerged to stabilize the market.
By the final minutes, HBAR recovered enough to close near $0.23, signaling that while downside risks remain, short-term support is holding for now.

- Token declined 3% from opening price of $0.24 to closing price of $0.23 over 23-hour institutional selling period.
- Trading range of $0.01 represents 4% spread between absolute session high and low.
- Resistance level established around $0.24 where institutional buying interest diminished significantly.
- Support level emerged near $0.23 with retail buying providing technical floor.
- Elevated volume of 85.82 million during final hours confirms institutional distribution patterns.
- Volume exceeded 3.8 million during peak selling period between 13:45-14:06 indicating coordinated liquidation.
- Final 14 minutes showed technical recovery from $0.23 support level suggesting retail buying interest.
Disclaimer: Parts of this article were generated with the assistance from AI tools and reviewed by our editorial team to ensure accuracy and adherence to our standards. For more information, see CoinDesk’s full AI Policy.
CoinDesk Analytics is CoinDesk’s AI-powered tool that, with the help of human reporters, generates market data analysis, price movement reports, and financial content focused on cryptocurrency and blockchain markets.
All content produced by CoinDesk Analytics is undergoes human editing by CoinDesk’s editorial team before publication. The tool synthesizes market data and information from CoinDesk Data and other sources to create timely market reports, with all external sources clearly attributed within each article.
CoinDesk Analytics operates under CoinDesk’s AI content guidelines, which prioritize accuracy, transparency, and editorial oversight. Learn more about CoinDesk’s approach to AI-generated content in our AI policy.

Oliver Knight is the co-leader of CoinDesk data tokens and data team. Before joining CoinDesk in 2022 Oliver spent three years as the chief reporter at Coin Rivet. He first started investing in bitcoin in 2013 and spent a period of his career working at a market making firm in the UK. He does not currently have any crypto holdings.

More For You
By James Van Straten, AI Boost, Stephen Alpher|Edited by Stephen Alpher
26 minutes ago

MSTR fell to a five-month low Wednesday, testing key technical support.
What to know:
- MSTR is down 30% from its 2025 peak of $457 hit last month and now trades just below the 200-DMA at $340, a level that has historically acted as support.
- Bitcoin has dipped 3.5% over the past month, while Strategy has sizably underperformed, plunging 21%.
- Jim Chanos previously opened up a short MSTR/long BTC bet that’s looking like a winner at the moment.


