-
Back to menu
Prices
-
Back to menu
-
Back to menu
Indices -
Back to menu
Research
-
Back to menu
Events -
Back to menu
Sponsored
-
Back to menu
Videos -
Back to menu
-
Back to menu
-
Back to menu
Webinars
Select Language
By CD Analytics, Oliver Knight
Updated Aug 26, 2025, 10:33 a.m. Published Aug 26, 2025, 10:33 a.m.

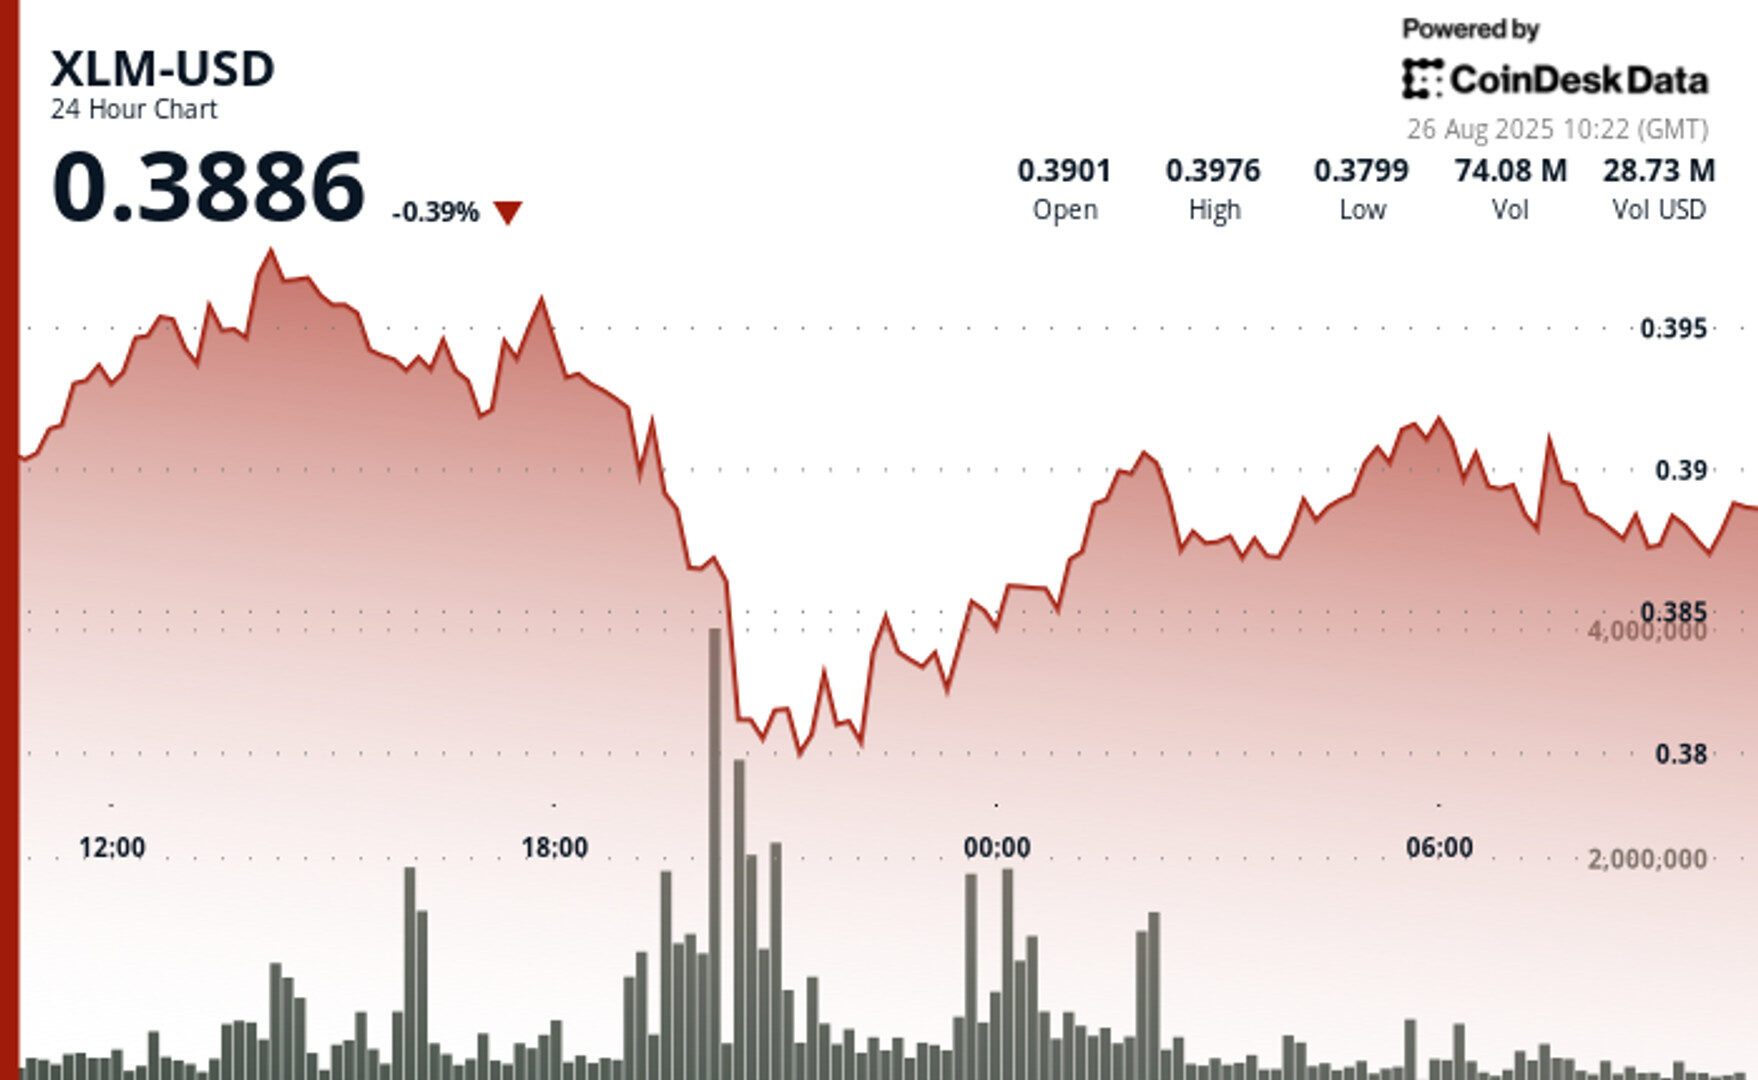
- Stellar’s XLM slid 5% from $0.398 to $0.380 in the past 24 hours before rebounding to $0.389, with $0.380 confirmed as a key support level on record trading volumes.
- Heavy sell pressure cemented $0.393 as resistance, as 46.16 million tokens traded hands at that level, while intraday action showed modest recovery amid high volatility.
- Broader sentiment is shaped by ETF filings and technical patterns, with traders watching for a potential breakout if XLM can reclaim momentum toward the $0.50 resistance zone.
Stellar’s native token XLM faced intense pressure over the past 24 hours, plunging from a session high of $0.398 to a low of $0.380. The 5% swing unfolded amid heavy sell-side activity, with the most dramatic capitulation striking on Aug. 25 at 19:00 UTC, when prices tumbled from $0.393 to $0.387. That move coincided with a surge of 46.16 million tokens changing hands—well above the daily average—effectively locking in $0.393 as a formidable resistance zone.
The selloff reached its peak just an hour later as XLM tested the $0.380 support level on unprecedented trading volume of 95.27 million tokens, confirming the level as a critical line of defense for bulls. Despite the pressure, the token rebounded into the close, clawing back to $0.389 by the end of the session and underscoring the resilience of buyer demand at the $0.380 floor.
STORY CONTINUES BELOW
Market sentiment is being shaped by broader developments as well. A recently filed U.S.-based crypto ETF aims to spotlight homegrown digital assets, including Stellar, potentially opening the door to new waves of institutional capital. At the same time, technical patterns suggest that XLM is coiling beneath a major resistance level near $0.50, with traders eyeing the possibility of a breakout if momentum shifts back to the upside.
Intraday trading action highlighted this tension. Between 07:20 and 08:19 UTC on Aug. 26, XLM navigated a narrow band between $0.387 and $0.392, logging a modest 0.18% gain from its session open. The brief rally to $0.392 was powered by bursts of high-volume buying, but profit-taking capped momentum. With volumes surging 115% on the day to $402 million, the clash between heavy selling pressure and potential whale accumulation remains the defining narrative for Stellar’s near-term trajectory.

- Price battlefield: $0.018 representing a brutal 5% war zone from $0.398 maximum to $0.380 minimum during the 24-hour combat period.
- Volume nuclear explosion: 95.27 million units detonating at $0.380 support bunker, 115% above average trading ammunition.
- Resistance fortress: Impenetrable wall established at $0.393 with 46.16 million unit volume confirmation artillery.
- Support stronghold: Mission-critical demand fortress confirmed at $0.380 with massive volume validation firepower.
- Recovery offensive: Systematic advance toward $0.389 following support test with strategically decreasing volume.
- Intraday chaos: 5% volatility range indicating extreme market warfare and institutional battle activity.
Disclaimer: Parts of this article were generated with the assistance from AI tools and reviewed by our editorial team to ensure accuracy and adherence to our standards. For more information, see CoinDesk’s full AI Policy.
CoinDesk Analytics is CoinDesk’s AI-powered tool that, with the help of human reporters, generates market data analysis, price movement reports, and financial content focused on cryptocurrency and blockchain markets.
All content produced by CoinDesk Analytics is undergoes human editing by CoinDesk’s editorial team before publication. The tool synthesizes market data and information from CoinDesk Data and other sources to create timely market reports, with all external sources clearly attributed within each article.
CoinDesk Analytics operates under CoinDesk’s AI content guidelines, which prioritize accuracy, transparency, and editorial oversight. Learn more about CoinDesk’s approach to AI-generated content in our AI policy.

Oliver Knight is the co-leader of CoinDesk data tokens and data team. Before joining CoinDesk in 2022 Oliver spent three years as the chief reporter at Coin Rivet. He first started investing in bitcoin in 2013 and spent a period of his career working at a market making firm in the UK. He does not currently have any crypto holdings.

More For You
By Omkar Godbole, AI Boost|Edited by Parikshit Mishra
2 hours ago

Ether, solana, and XRP maintain relatively stronger positions.
What to know:
- Bitcoin’s price has fallen below the 100-day simple moving average for the first time since April, boltering the bearish outlook.
- The cryptocurrency’s technical outlook has worsened, with prices also dropping below the Ichimoku cloud.
- Ether, solana, and XRP maintain relatively stronger positions.


