-
Back to menu
Prices
-
Back to menu
-
Back to menu
Indices -
Back to menu
Research
-
Back to menu
Events -
Back to menu
Sponsored
-
Back to menu
Videos -
Back to menu
-
Back to menu
-
Back to menu
Webinars
Select Language
By CD Analytics, Oliver Knight
Updated Aug 26, 2025, 11:24 a.m. Published Aug 26, 2025, 11:23 a.m.

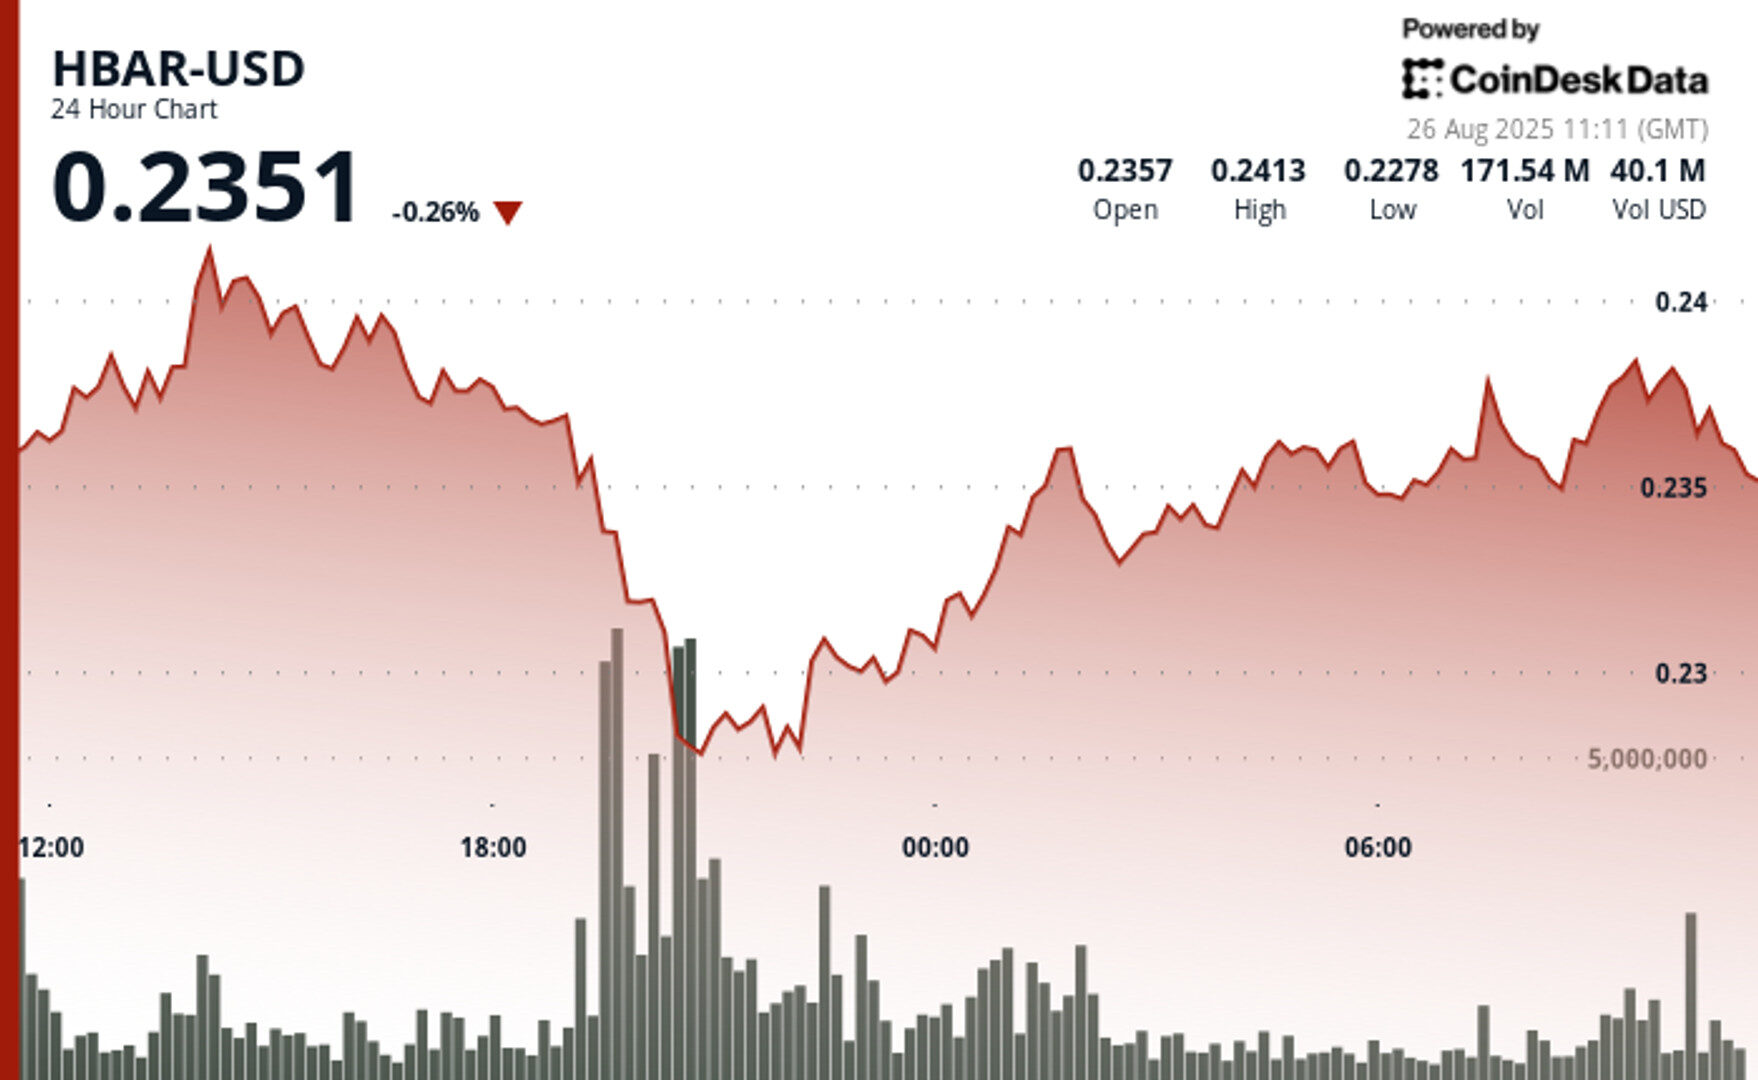
- HBAR swung 5.83% between $0.242 and $0.228, with a sharp Aug. 25 selloff quickly reversing on heavy buy-side support.
- A 169.5 million token volume spike at $0.228 signaled strong institutional demand that stabilized prices and drove a rebound.
- The $0.236300–$0.238270 consolidation zone points to accumulation, with a breakout above resistance likely dictating the next move.
Hedera’s HBAR token saw sharp swings in the past trading session, with price action reflecting both heavy sell pressure and signs of institutional support. Over the 23-hour window from Aug. 25 at 11:00 through Aug. 26 at 10:00, HBAR traded in a $0.014 range between $0.242 and $0.228, amounting to a 5.83% intraday move. The most notable volatility came during the 19:00–20:00 hour on Aug. 25, when the token fell from $0.237 to $0.228 in a steep selloff.
That decline, however, coincided with a surge in volume to 169.5 million tokens, suggesting large buyers stepped in at the $0.228 level. The sudden influx of demand stabilized prices and set the stage for a rebound, with HBAR retracing back toward $0.237 by the session’s close. Market observers point to this dynamic as an example of capitulation-driven selling creating opportunities for accumulation.
STORY CONTINUES BELOW
By the final hour of trading on Aug. 26, momentum tilted modestly back in favor of bulls. HBAR edged up 0.11% from $0.237359 to $0.237396 despite intraday dips as low as $0.236270. Price resilience above $0.236300 highlighted an emerging support zone, where buying activity consistently absorbed downward pressure.
The consolidation between $0.236300 and $0.238270 established a clear short-term range. With institutional flows appearing to reinforce the lower bound, analysts suggest the market may be preparing for its next decisive move. Whether HBAR can break beyond resistance at $0.238270 could determine if this rebound evolves into a broader uptrend.

Technical Indicators Analysis
- Volume spike to 169.5 million during the 25 August 19:00-20:00 correction confirmed robust support formation at the $0.228 price level
- Swift price recovery from $0.228 to $0.237 validates institutional accumulation activity and underlying market strength
- Range-bound trading between $0.236300-$0.238270 indicates accumulation phase preceding potential upside breakout
- Repeated support validation at $0.236300 zone reinforces strong institutional buying conviction at these price levels
- Resistance encounter at $0.238270 establishes clear parameters for near-term price action expectations
Disclaimer: Parts of this article were generated with the assistance from AI tools and reviewed by our editorial team to ensure accuracy and adherence to our standards. For more information, see CoinDesk’s full AI Policy.
CoinDesk Analytics is CoinDesk’s AI-powered tool that, with the help of human reporters, generates market data analysis, price movement reports, and financial content focused on cryptocurrency and blockchain markets.
All content produced by CoinDesk Analytics is undergoes human editing by CoinDesk’s editorial team before publication. The tool synthesizes market data and information from CoinDesk Data and other sources to create timely market reports, with all external sources clearly attributed within each article.
CoinDesk Analytics operates under CoinDesk’s AI content guidelines, which prioritize accuracy, transparency, and editorial oversight. Learn more about CoinDesk’s approach to AI-generated content in our AI policy.

Oliver Knight is the co-leader of CoinDesk data tokens and data team. Before joining CoinDesk in 2022 Oliver spent three years as the chief reporter at Coin Rivet. He first started investing in bitcoin in 2013 and spent a period of his career working at a market making firm in the UK. He does not currently have any crypto holdings.

More For You
By Omkar Godbole|Edited by Oliver Knight
13 minutes ago

Analysts suggest that BTC’s price struggles this month are linked to ETF outflows, with a potential bull run into the year-end requiring significant capital inflows.
What to know:
- The U.S.-listed spot bitcoin ETFs appear on track to register their second-largest monthly outflow on record.
- Analysts suggest that BTC’s price struggles this month are linked to ETF outflows, with a potential recovery requiring significant capital inflows.
- Ether ETFs, in contrast, continue to see strong demand, posting $3.23B in inflows this month and extending their winning streak since April.


