-
Back to menu
Prices
-
Back to menu
-
Back to menu
Indices -
Back to menu
Research
-
Back to menu
Events -
Back to menu
Sponsored
-
Back to menu
Videos -
Back to menu
-
Back to menu
-
Back to menu
Webinars
Select Language
Share this article
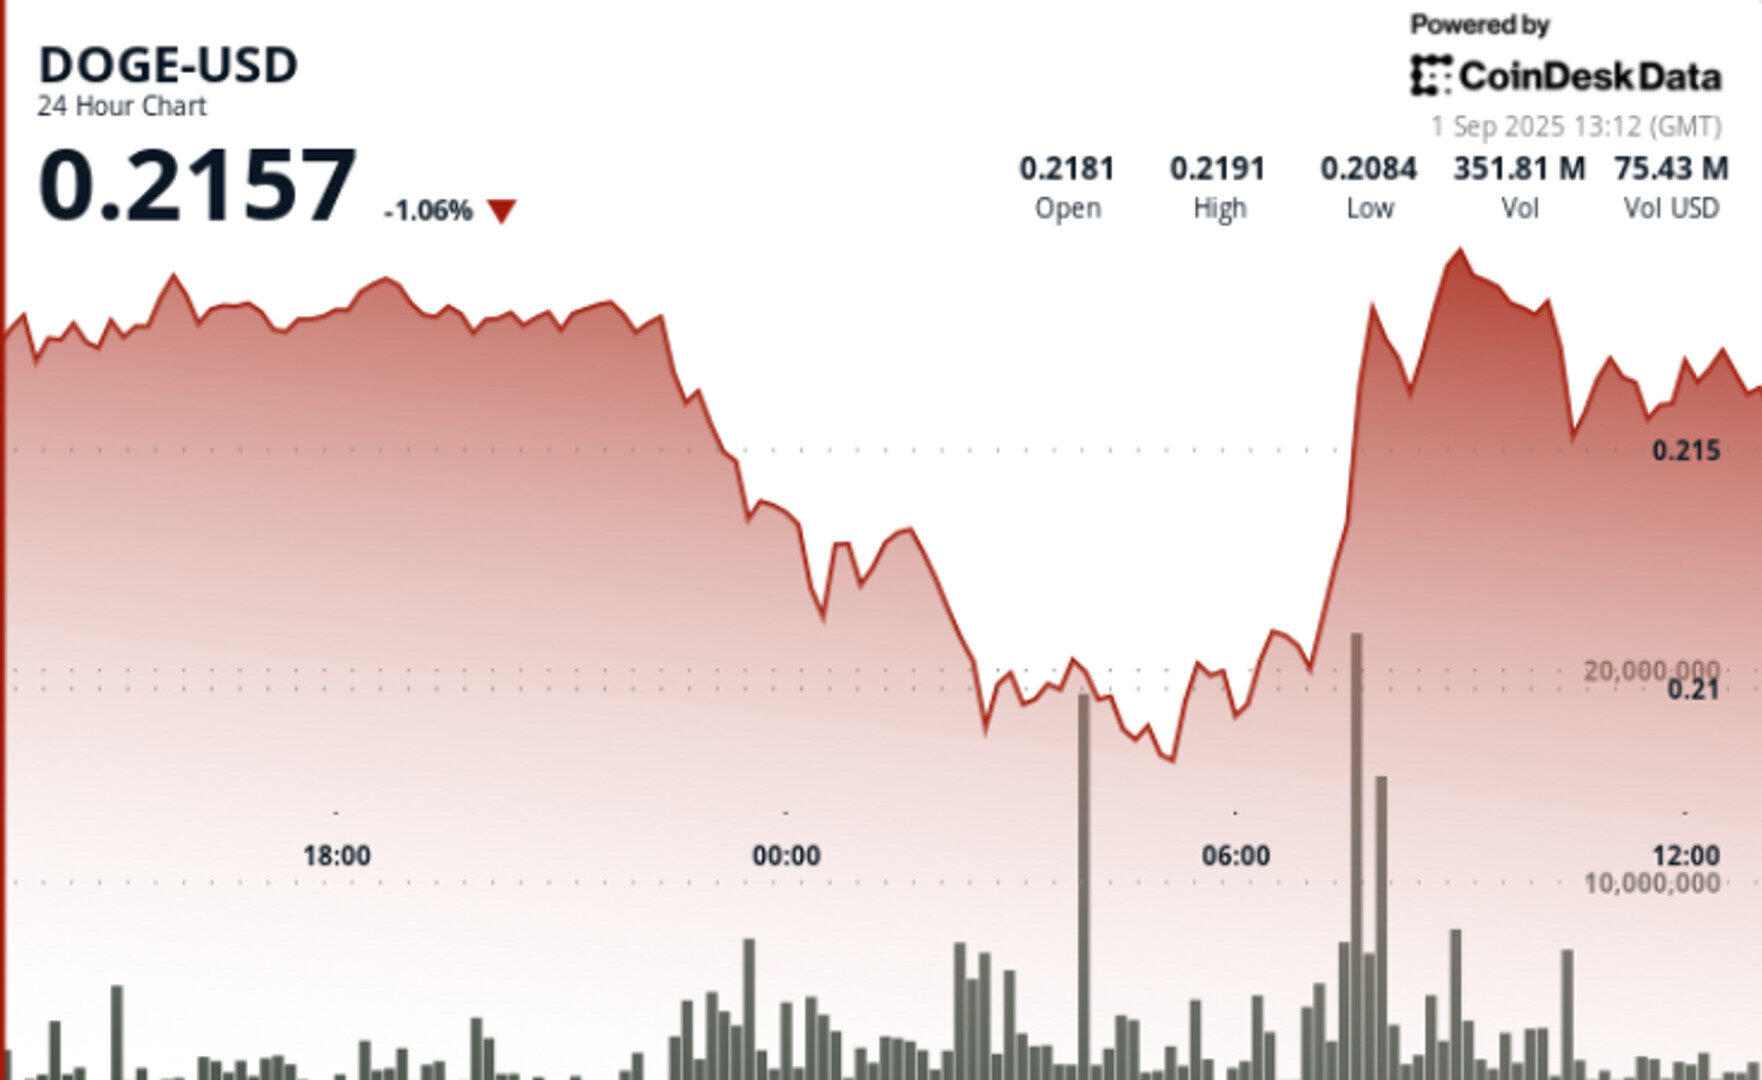
DOGE defended $0.21 and rebounded to $0.22 as volumes jumped (~808.9M). We map the key levels, why $0.225 matters, and what would confirm $0.25.
By Shaurya Malwa, CD Analytics
Updated Sep 1, 2025, 1:36 p.m. Published Sep 1, 2025, 1:36 p.m.

- DOGE experienced a volatile session with a significant rebound, trading 808.9M tokens, indicating increased institutional activity.
- The price fluctuated between $0.21 and $0.22, with $0.21 acting as a strong support level.
- Traders are monitoring for a breakout above $0.225 to signal a potential rally towards $0.25.
- DOGE traded through a volatile 23-hour session from Aug. 31 at 13:00 to Sept. 1 at 12:00, aligning with broader choppiness in altcoins as Bitcoin slipped intraday.
- On-chain trackers flagged 808.9M DOGE traded in the rebound, a ~14% jump compared with weekly averages of 378.5M, pointing to elevated institutional activity.
- Broader meme-coin markets saw rotation as investors probed alternatives like XYZVerse and MAGACOIN FINANCE, highlighting diversification away from established tokens.
- Macro backdrop remained cautious with geopolitical trade tensions and monetary policy divergence continuing to pressure risk assets while also driving interest in hedging tools such as DOGE.
- DOGE fluctuated in a $0.01 (5%) range between $0.21 and $0.22.
- Price held steady near $0.22 until 22:00 GMT Aug. 31, when selling pressure pushed the token to a $0.21 low by 05:00 GMT Sept. 1.
- A strong rebound began at 07:00 GMT, lifting DOGE from $0.73 to $0.22 on 808.9M turnover, more than double the daily average.
- In the concentrated 60-min window from 11:18–12:17 GMT, DOGE dipped to $0.21 before recovering to $0.22, with a 13.9M spike at 12:09 GMT confirming institutional accumulation.
- Support: $0.21 established as the structural floor, repeatedly defended during overnight selloff.
- Resistance: $0.22 remains the immediate ceiling; break above $0.225 is needed for continuation.
- Momentum: RSI stabilizing near the mid-50s, suggesting neutral-to-bullish bias.
- MACD: Histogram compression signals a potential crossover, with upside risk if volumes persist.
- Patterns: Price action forming a short-term consolidation band; a cup-and-handle setup remains on watch with targets near $0.25–$0.30 if resistance clears.
- Volume: 808.9M in recovery phase vs. 378.5M average underscores institutional flow behind the rebound.
- Whether $0.21 support continues to hold under renewed sell pressure.
- A decisive close above $0.225 as the trigger for a rally toward $0.25.
- Futures open interest and whale exchange flows as leading indicators of sentiment shift.
- Macro drivers — especially Fed signaling and trade headlines — that could tilt flows back into or away from risk assets.
More For You
By James Van Straten|Edited by Sheldon Reback
37 minutes ago
The on-chain metric is rising despite bitcoin falling to more than 12% below its all-time high.
What to know:
- Bitcoin’s realized cap, which values tokens only when they move, rose past $1 trillion in July and now sits at a record $1.05 trillion.
- The increase contrasts with a drop in market cap, which revalues all tokens based on the spot price.
- The measure provides an insight into the conviction of bitcoin holders in their investment.


