BTC
$104,327.19
–
3.31%
ETH
$2,493.91
–
5.62%
USDT
$1.0001
–
0.03%
XRP
$2.1769
–
5.98%
BNB
$644.99
–
1.99%
SOL
$146.97
–
6.72%
USDC
$0.9998
–
0.01%
TRX
$0.2742
–
2.29%
DOGE
$0.1670
–
6.60%
ADA
$0.6099
–
6.99%
HYPE
$39.38
–
12.15%
WBT
$48.10
–
6.63%
SUI
$2.8484
–
8.98%
BCH
$462.55
–
0.75%
LINK
$13.00
–
6.23%
LEO
$9.2009
–
0.55%
XLM
$0.2543
–
4.97%
AVAX
$18.59
–
6.10%
TON
$2.9574
–
2.24%
SHIB
$0.0₄1151
–
5.86%
By Siamak Masnavi, CD Analytics|Edited by Aoyon Ashraf
Jun 17, 2025, 3:39 p.m.

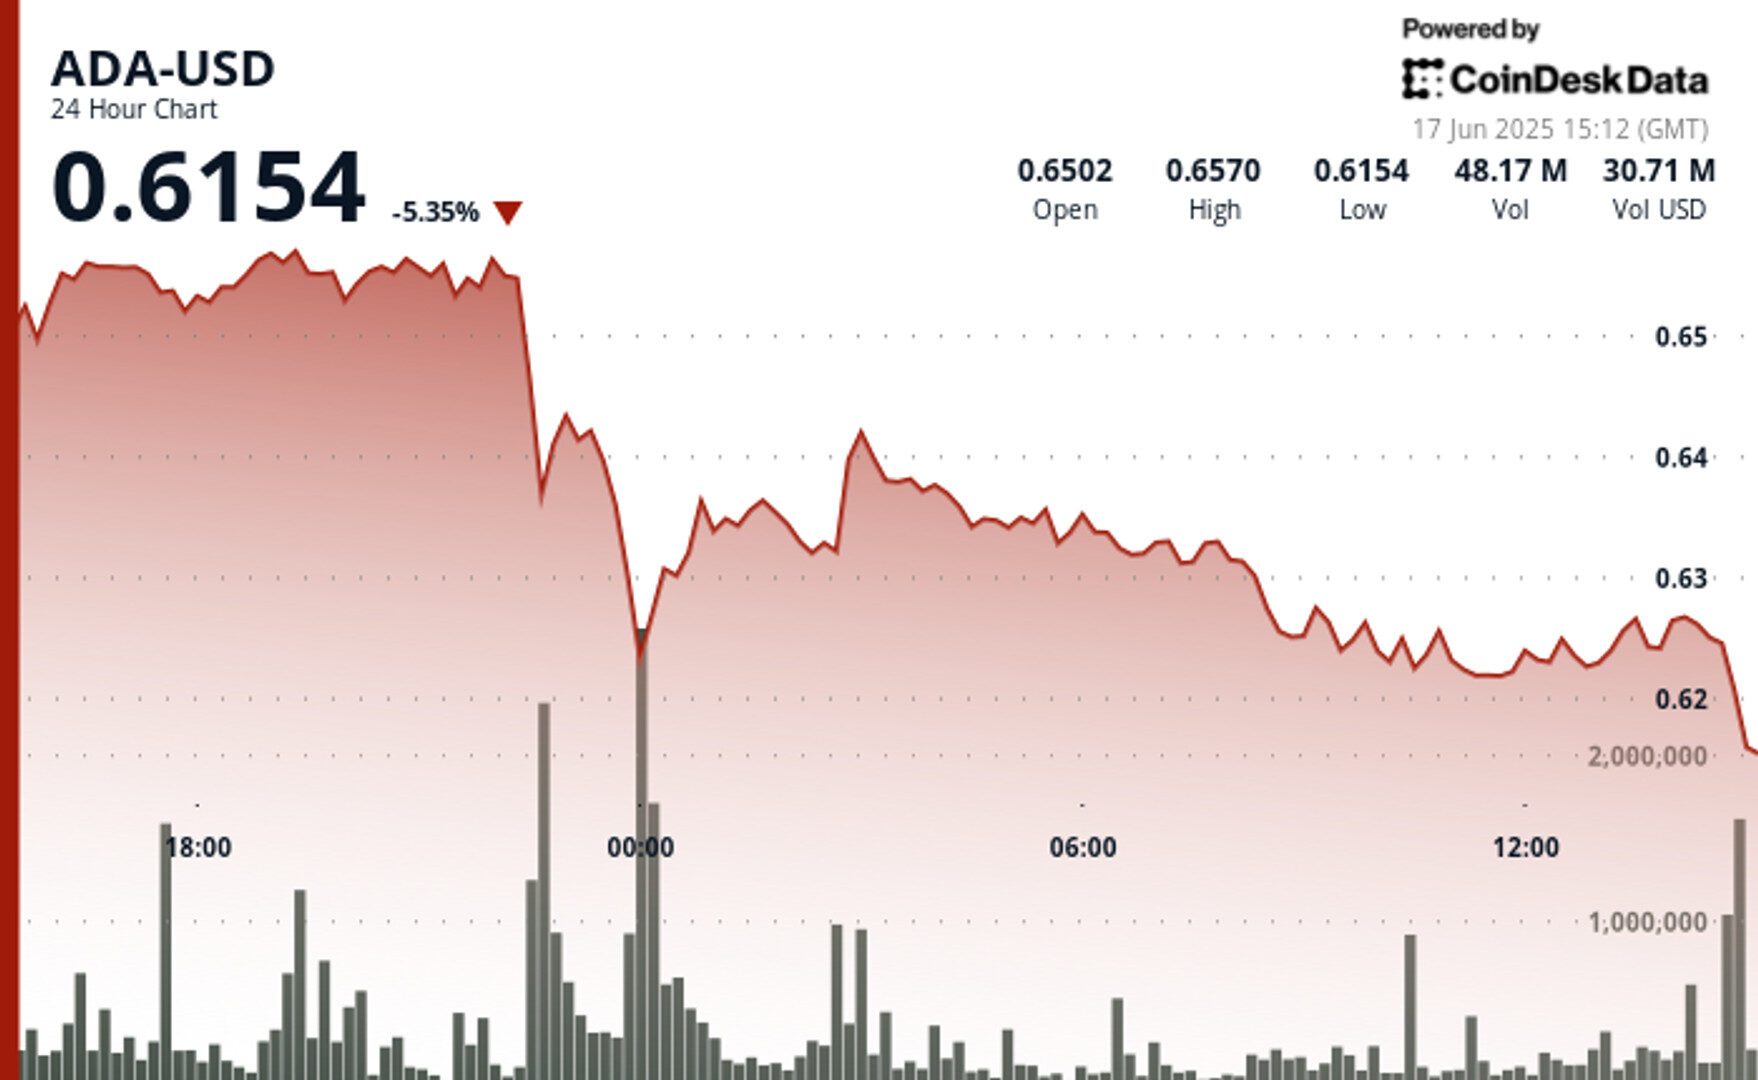
- ADA declined 5.35% over the past 24 hours, dropping from a high of $0.657 to $0.6154.
- The sell-off began late Monday and broke through support at $0.650, with $0.620 emerging as a potential floor, according to CoinDesk Research’s technical analysis model.
- Analysts identified a possible bullish wedge pattern, though price remains under pressure in a descending channel.
Cardano’s ADA
token traded at $0.6154 Monday afternoon, extending its decline to 5.35% over the past 24 hours. The token dropped steadily through multiple support levels after a late-session sell-off began around 22:00 UTC on June 16. Despite a brief recovery attempt earlier in the session, the bearish structure remained intact heading into midday Tuesday.
The correction mirrors broader risk-off behavior across digital assets as global macroeconomic conditions remain tense. Trade disputes and monetary tightening across major economies have added pressure to risk markets, dragging ADA and other large-cap tokens lower.
STORY CONTINUES BELOW
Still, some technical analysts have pointed to potential signs of a reversal in ADA’s structure. A brief bounce from $0.622 to $0.626 earlier in the session formed a small upward-sloping channel, with price testing the $0.624–$0.625 band multiple times. That area has now emerged as a potential pivot zone, though volume has since tapered and volatility has narrowed.
With ADA trading just above its daily low, bulls are watching for stabilization around $0.615–$0.620. A clear directional move from here may depend on whether that support zone holds and if broader market conditions begin to recover.
Technical Analysis Highlights
- A sharp decline began at 22:00 UTC on June 16 as ADA broke below the $0.650 support level on high volume.
- Multiple failed attempts to reclaim $0.630 created a new resistance band around $0.640.
- Lower highs formed with each bounce, confirming downward pressure throughout the period.
- A support zone developed between $0.620 and $0.622 as volume picked up at those levels.
- Price entered a descending channel with consistent lower highs and lower lows.
- A brief recovery from $0.622 to $0.626 created an upward-sloping micro channel amid increasing volume.
- Resistance formed at $0.626, with the $0.624–$0.625 area acting as a pivot range during repeated tests.
- Recent candles showed decreasing volatility and volume, signaling consolidation near local lows.
Disclaimer: Parts of this article were generated with the assistance from AI tools and reviewed by our editorial team to ensure accuracy and adherence to our standards. For more information, see CoinDesk’s full AI Policy.
Siamak Masnavi is a researcher specializing in blockchain technology, cryptocurrency regulations, and macroeconomic trends shaping the crypto market. He holds a PhD in computer science from the University of London and began his career in software development, including four years in the banking industry in the City of London and Zurich. In April 2018, Siamak transitioned to writing about cryptocurrency news, focusing on journalism until January 2025, when he shifted exclusively to research on the aforementioned topics.

CoinDesk Analytics is CoinDesk’s AI-powered tool that, with the help of human reporters, generates market data analysis, price movement reports, and financial content focused on cryptocurrency and blockchain markets.
All content produced by CoinDesk Analytics is undergoes human editing by CoinDesk’s editorial team before publication. The tool synthesizes market data and information from CoinDesk Data and other sources to create timely market reports, with all external sources clearly attributed within each article.
CoinDesk Analytics operates under CoinDesk’s AI content guidelines, which prioritize accuracy, transparency, and editorial oversight. Learn more about CoinDesk’s approach to AI-generated content in our AI policy.


