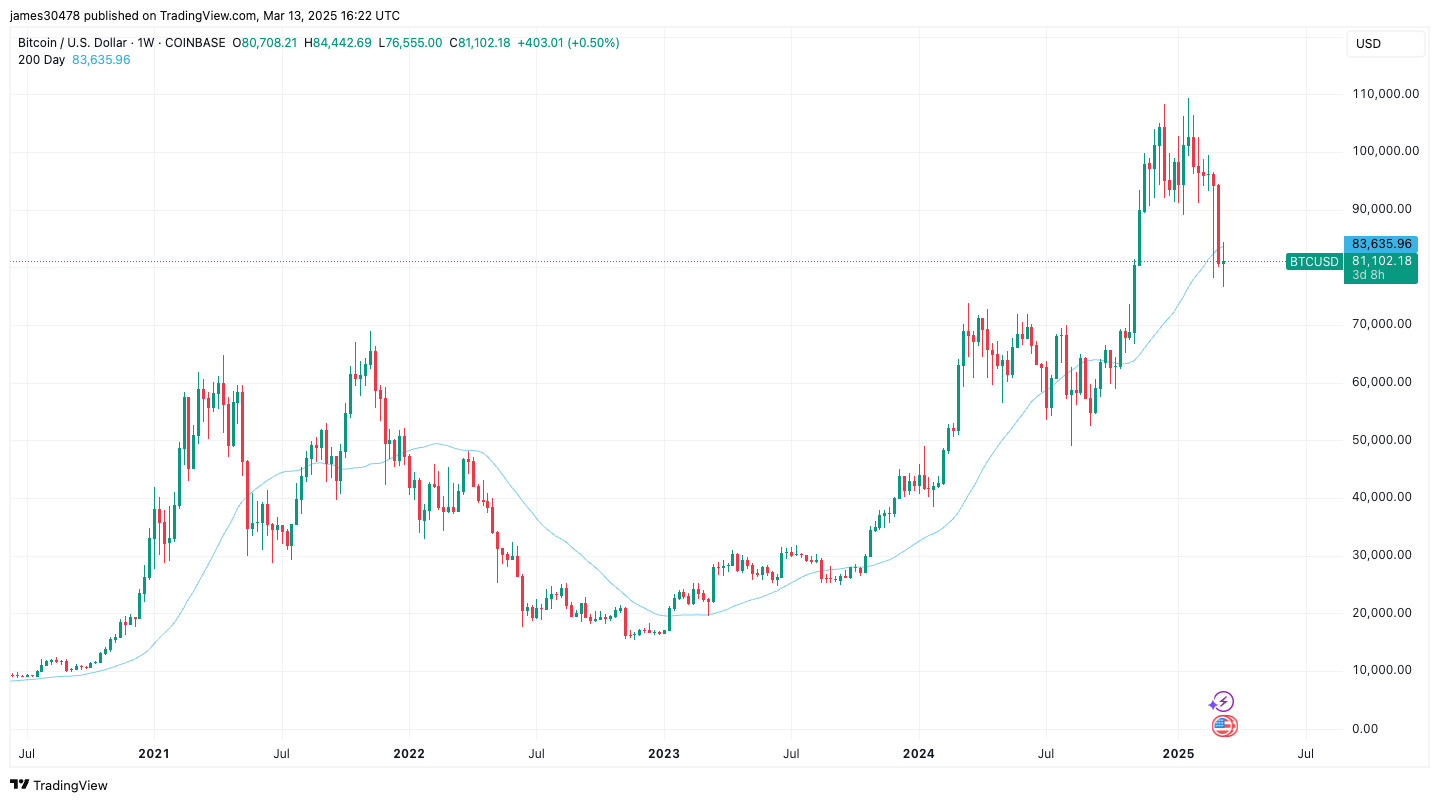
Bitcoin (BTC) continued to struggle on Thursday as it fought to stay above $80,000. The largest cryptocurrency by market cap is currently down 3% on the day. It has declined 13% in the first quarter and is about 30% off its all-time high from January.
According to Glassnode data, short-term holders — investors who have held bitcoin for less than 155 days — are primarily considered speculators who tend to enter the market during price peaks or periods of market euphoria. Since February, they have sold more than 100,000 BTC (about $8 billion at current prices), a sign they’re looking to cut losses (or lock in any profits) before prices fall further.
Story continues
The decline has pushed the bitcoin price below its 200-day moving average of $86,300. The average is an important metric for long-term market trends, and BTC isn’t the only risk-on investment to drop below.
U.S. equities, as measured by the S&P 500, have also lost that level. The index is currently around 5,537 while the 200-day average is at 5,738.
According to Joe Carlasare, a commercial litigator supporting bitcoin, when the S&P 500 struggles to reclaim the 200-DMA, history suggests lower prices are in the offing.
“The S&P 500 continues to struggle to reclaim the 200 day,” he wrote on X. “If we can’t get a big rally above it soon, it makes sense to expect lower prices Look back historically what happens when we loose the 200 day.”