-
Back to menu
Prices
-
Back to menu
-
Back to menu
Indices -
Back to menu
Research
-
Back to menu
Events -
Back to menu
Sponsored
-
Back to menu
Videos -
Back to menu
-
Back to menu
-
Back to menu
Webinars
Select Language
By Siamak Masnavi, AI Boost|Edited by Aoyon Ashraf
Updated Aug 10, 2025, 3:57 p.m. Published Aug 9, 2025, 9:55 p.m.

- Bitcoin is up 25.2% so far in 2025 as of Aug. 8, second only to gold’s 29% gain.
- Since 2011, bitcoin’s total return has exceeded gold’s by over 308,000 times.
- BTC has also led annualized gains since 2011, far outpacing equities and real estate.
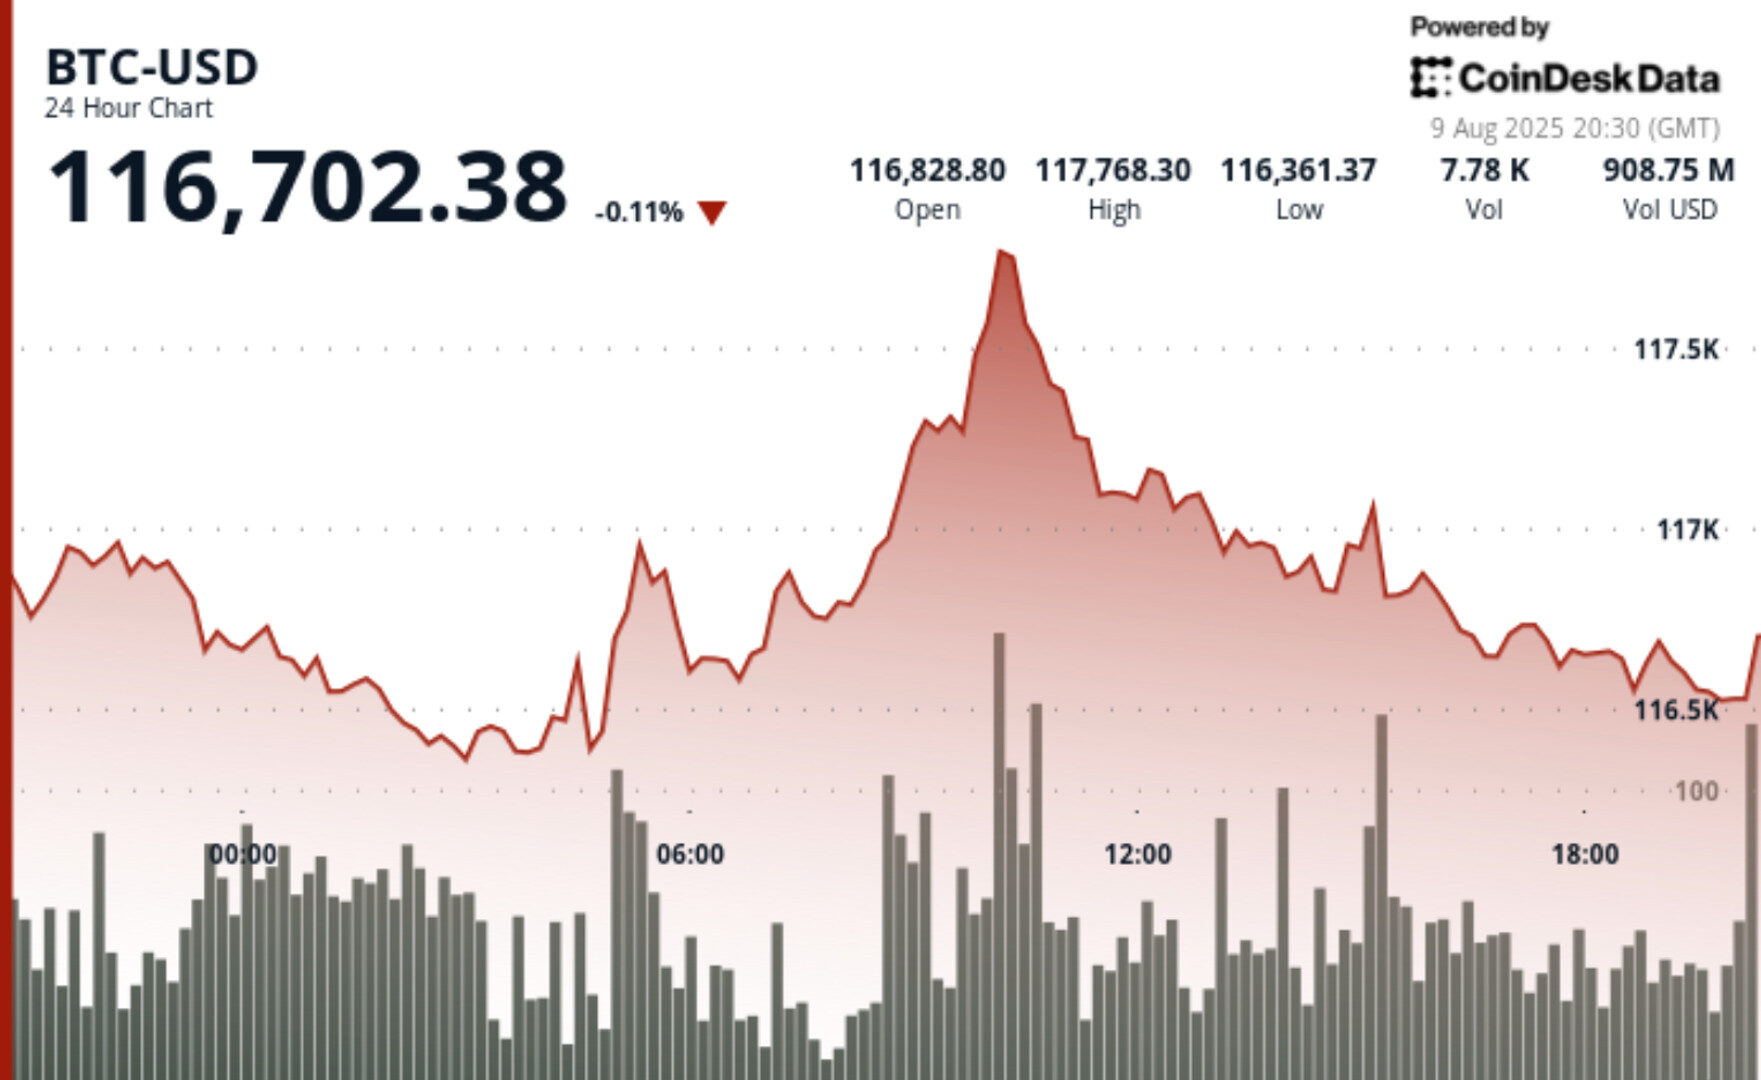
Bitcoin slipped 0.11% in the past 24 hours to $116,702, according to CoinDesk Data, but it remains up 25% year to date, second only to gold’s 29% gain among major asset classes, according to data shared by financial strategist Charlie Bilello on X.
Both assets have outperformed other major asset classes this year, such as emerging market stocks (VWO +15.6%), the Nasdaq 100 (QQQ +12.7%) and U.S. large caps (SPY +9.4%). Meanwhile, U.S. mid-caps (MDY) and small-caps (IWM) have only gained 0.2% and 0.8%, respectively, his data showed.

STORY CONTINUES BELOW
This marks the first time gold and bitcoin have occupied the top two positions in Bilello’s annual asset class rankings since records began.
However, zooming out, bitcoin has delivered an extraordinary 38,897,420% total return since 2011 — a figure that dwarfs all other asset classes in the dataset.
Gold’s 126% cumulative return over the same period puts it in the middle of the pack, trailing equity benchmarks like the Nasdaq 100 (1101%) and U.S. large caps (559%), as well as mid caps (316%), small caps (244%) and emerging market stocks (57%).
Based on Bilello’s figures, bitcoin’s total return has exceeded gold’s by more than 308,000 times over the past 14 years.
When measured on an annualized basis, bitcoin’s dominance is equally clear.
The flagship cryptocurrency has delivered a 141.7% average annual gain since 2011, compared with 5.7% for gold, 18.6% for the Nasdaq 100, 13.8% for U.S. large caps and 4.4% to 16.4% for other major equity and real estate indexes, Bilello’s data showed.
Gold’s long-term stability has made it a valuable hedge in certain market cycles, but its pace of appreciation has been far slower than bitcoin’s exponential climb.
Renowned trader Peter Brandt weighed in on Aug. 8, contrasting gold’s merits as a store of value with bitcoin’s potential to surpass all fiat alternatives.
“Some think gold is a great store of value — and it is. But the ultimate store of value will prove to be bitcoin,” he said on X, sharing a long-term chart of the U.S. dollar’s purchasing power.
His comments echo the growing narrative that bitcoin’s scarcity and decentralization make it uniquely positioned to outperform traditional hedges over time.
Read more: Chart of the Week: Tariff Carnage Starting to Fulfill Bitcoin’s ‘Store of Value’ Promise
Bitcoin’s ability to hold above six figures in 2025 while maintaining a top-two performance among major assets underscores its resilience in a volatile macro backdrop.
Traders are watching whether it can retest the year’s peak near $123,000, while long-term holders point to its outperformance since 2011 as evidence of its staying power. Market participants say upcoming macro data and risk appetite across equities and commodities could set the tone for the next leg.
Read more: Bitcoin Still on Track for $140K This Year, But 2026 Will Be Painful: Elliott Wave Expert
Disclaimer: Parts of this article were generated with the assistance from AI tools and reviewed by our editorial team to ensure accuracy and adherence to our standards. For more information, see CoinDesk’s full AI Policy.
Siamak Masnavi is a researcher specializing in blockchain technology, cryptocurrency regulations, and macroeconomic trends shaping the crypto market. He holds a PhD in computer science from the University of London and began his career in software development, including four years in the banking industry in the City of London and Zurich. In April 2018, Siamak transitioned to writing about cryptocurrency news, focusing on journalism until January 2025, when he shifted exclusively to research on the aforementioned topics.

“AI Boost” indicates a generative text tool, typically an AI chatbot, contributed to the article. In each and every case, the article was edited, fact-checked and published by a human. Read more about CoinDesk’s AI Policy.

More For You
1 hour ago

JPMorgan expects a high single-digit rise in the S&P 500 over the next 12 months.
What to know:
- JPMorgan expects a high single-digit rise in the S&P 500 over the next 12 months.
- The bank cited three bullish catalysts, including resilient corporate earnings.


