BNB Slips 2.7% As Traders Focus on Technicals During Crypto Market Drawdown
The decline was part of a broader crypto market drop, with traders focusing on technical cues and selling dominating
By CD Analytics, Francisco Rodrigues|Edited by Jamie Crawley
Oct 29, 2025, 4:11 p.m.

- BNB’s price dropped 2.7% to $1,105 after a brief rise following BNB Chain’s largest-ever quarterly token burn, which removed 1.44 million BNB from circulation.
- The decline was part of a broader crypto market drop, with traders focusing on technical cues and selling dominating.
- Despite the short-term bearish trend, a report from Binance founder’s family office YZi Labs framed BNB as a long-term structural asset.
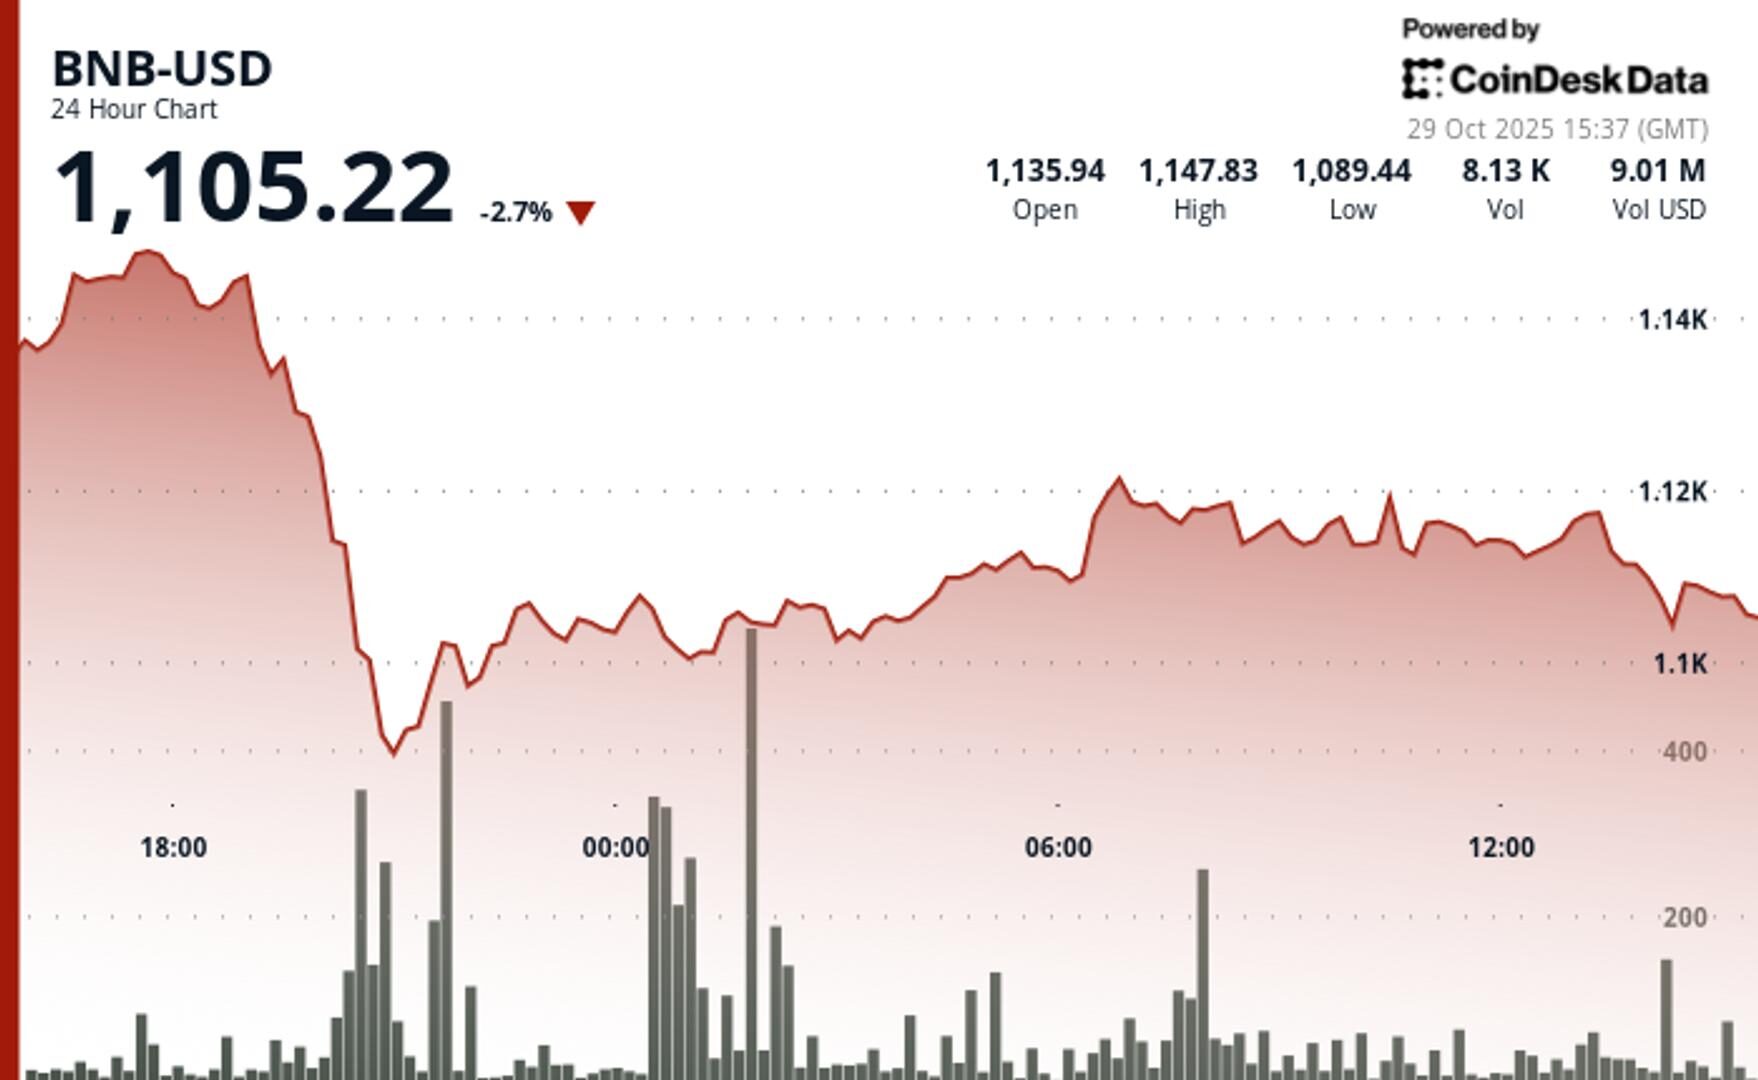
BNB’s price slid 2.7% in the last 24-hour period to $1,105 after the rise that started after BNB Chain’s largest-ever quarterly token burn in U.S. dollar terms faded out.
The decline undercut hopes that the $1.6 billion reduction in supply would further support the price. BNB Chain burned 1.44 million BNB as part of the token’s deflationary model, shrinking the token’s total supply to roughly 137.7 million.
STORY CONTINUES BELOW
Traders, however, were focused elsewhere, with the crypto market as a whole dropping 1.8% over the period, measured via the CoinDesk 20 (CD20) index.
When the $1,128 support level failed, volume surged and prices cascaded lower, briefly hitting an intraday low of $1,076. Over 308,000 BNB changed hands in a single hour, nearly three times the usual daily average according to CoinDesk Research’s technical analysis data model.
Rebound attempts repeatedly stalled near $1,110, forming a series of lower highs and reinforcing the bearish structure. Short-term oversold conditions didn’t stop the slide.
Traders have nevertheless been reacting to technical cues, an environment where key price levels and volume shifts carry more weight than structural design. For now, the chart points to $1,076 as the next major support.
A convincing break above $1,128 would be needed to shift market sentiment. Until then, momentum remains pointed down.
Disclaimer: Parts of this article were generated with the assistance from AI tools and reviewed by our editorial team to ensure accuracy and adherence to our standards. For more information, see CoinDesk’s full AI Policy.
More For You
Oct 16, 2025

Stablecoin payment volumes have grown to $19.4B year-to-date in 2025. OwlTing aims to capture this market by developing payment infrastructure that processes transactions in seconds for fractions of a cent.
More For You
By CD Analytics, Oliver Knight
13 minutes ago

Hedera faces selling pressure at $0.2055 resistance as trading volume explodes 137% above average, marking institutional distribution amid choppy price action.
What to know:
- HBAR faces heavy resistance near $0.2055, with a 137% surge in trading volume signaling possible institutional selling and strong distribution pressure at that level.
- Support at $0.1938 remains critical, holding firm through multiple tests, but lower highs ($0.2044, $0.2032, $0.2017) reinforce a bearish short-term trend.
- Despite a temporary boost from the new Nasdaq-listed spot HBAR ETF, momentum has shifted back to sellers as intraday volatility and halted trading point to potential instability.


-
Back to menu
Prices
-
Back to menu
-
Back to menu
Indices -
Back to menu
Research
-
Back to menu
Consensus 2026 -
Back to menu
Sponsored
-
Back to menu
Videos -
Back to menu
-
Back to menu
-
Back to menu
Webinars
Select Language