-
Back to menu
Prices
-
Back to menu
-
Back to menu
Indices -
Back to menu
Research
-
Back to menu
Events -
Back to menu
Sponsored
-
Back to menu
Videos -
Back to menu
-
Back to menu
-
Back to menu
Webinars
Select Language
By Jamie Crawley, CD Analytics|Edited by Aoyon Ashraf
Aug 15, 2025, 1:10 p.m.

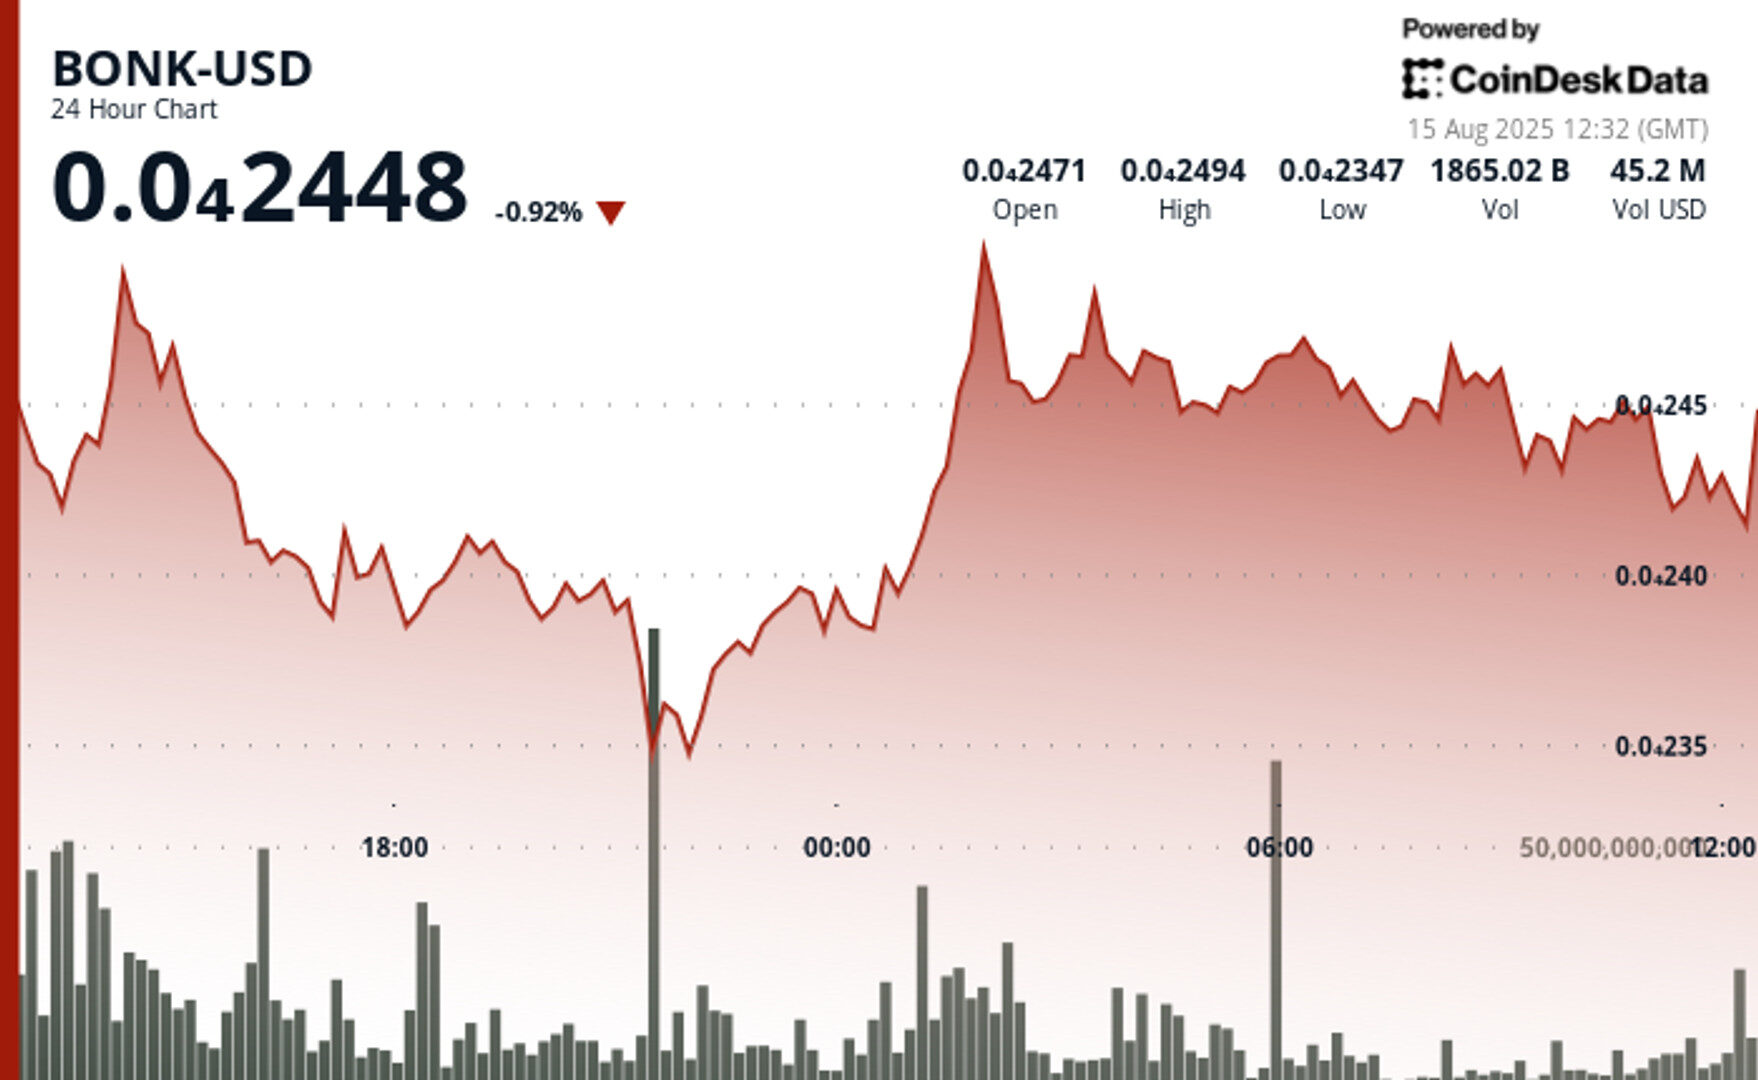
- BONK traded between $0.000023 and $0.000026 over the past 23 hours, ending at $0.00002448.
- Institutional volumes reached 4.02T tokens at $0.000026, confirming strong resistance.
- Support at $0.000023 held firm, with late-session buying lifting prices back toward $0.000025.
Solana-based meme coin BONK weathered a volatile 24 hours, as significant institutional activity defined both the highs and lows of the trading range.
The token reached $0.000026 and quickly encountered resistance at that level, with 4.02 trillion tokens changing hands during a midday rejection that set a clear technical ceiling for the short term, according to CoinDesk Research’s technical analysis data model.
STORY CONTINUES BELOW
From there, BONK slipped 6% to find a floor near $0.000023, where 1.07 trillion tokens traded as buyers absorbed the sell pressure. This zone has now emerged as a key support level, tested multiple times without breaking.
BONK subsequently staged a modest recovery, gaining roughly 1% from $0.000024 to $0.00002425. The rebound was fueled by sharp volume spikes at 10:48 UTC and 10:49 UTC, 21.99 billion and 31.43 billion tokens, respectively, suggesting accumulation from larger players just above prior resistance.
Traders now face a defined battle line: resistance remains fixed at $0.000026, with support anchored at $0.000023. A sustained push above $0.000025 could signal the beginning of a more pronounced upward move, while a break of the lower bound risks retesting early-August lows, according to the model.
BONK’s continued high liquidity, even amid recent volatility, underscores its position as one of the more active tokens in the meme coin sector. Institutional participation has kept price action tightly bound, but it has also increased the potential for sudden breakouts should order books thin at key levels.
- Trading range: $0.000023–$0.000026 over the 23-hour period.
- Resistance locked at $0.000026 after 4.02T token sell wall.
- Support confirmed at $0.000023 with 1.07T tokens traded.
- Price closed at $0.00002448, down 0.92% over the period.
- Late-session bounce from $0.000024 to $0.00002425 (+1%).
- Volume spikes at 10:48 UTC (21.99B) and 10:49 UTC (31.43B) suggest accumulation.
- Consolidation zone emerging between $0.000024 and $0.000025.
Disclaimer: Parts of this article were generated with the assistance from AI tools and reviewed by our editorial team to ensure accuracy and adherence to our standards. For more information, see CoinDesk’s full AI Policy.
Jamie has been part of CoinDesk’s news team since February 2021, focusing on breaking news, Bitcoin tech and protocols and crypto VC. He holds BTC, ETH and DOGE.

CoinDesk Analytics is CoinDesk’s AI-powered tool that, with the help of human reporters, generates market data analysis, price movement reports, and financial content focused on cryptocurrency and blockchain markets.
All content produced by CoinDesk Analytics is undergoes human editing by CoinDesk’s editorial team before publication. The tool synthesizes market data and information from CoinDesk Data and other sources to create timely market reports, with all external sources clearly attributed within each article.
CoinDesk Analytics operates under CoinDesk’s AI content guidelines, which prioritize accuracy, transparency, and editorial oversight. Learn more about CoinDesk’s approach to AI-generated content in our AI policy.

More For You
By James Van Straten, AI Boost|Edited by Oliver Knight
3 hours ago

BTC and MSTR post Sharpe ratios above 2.0, far outpacing tech peers around 1.0, while implied volatility drops to new lows.
What to know:
- Bitcoin implied volatility is near a 2-year low at 37%, while MSTR volatility is down from highs of 140% to 56%.
- BTC Sharpe ratio is at 2.15 and MSTR at 2.00, both well ahead of large-cap tech names clustered near 1.0.


