BONK Regains Some Ground With 4.6% Gain
-
News
-
Video
-
Consensus 2026
-
Data & Indices
BONK climbs above $0.00001380 resistance with 67% volume surge as meme token rallies toward new short-term highs.
By Jamie Crawley, CD Analytics
Oct 31, 2025, 4:47 p.m.

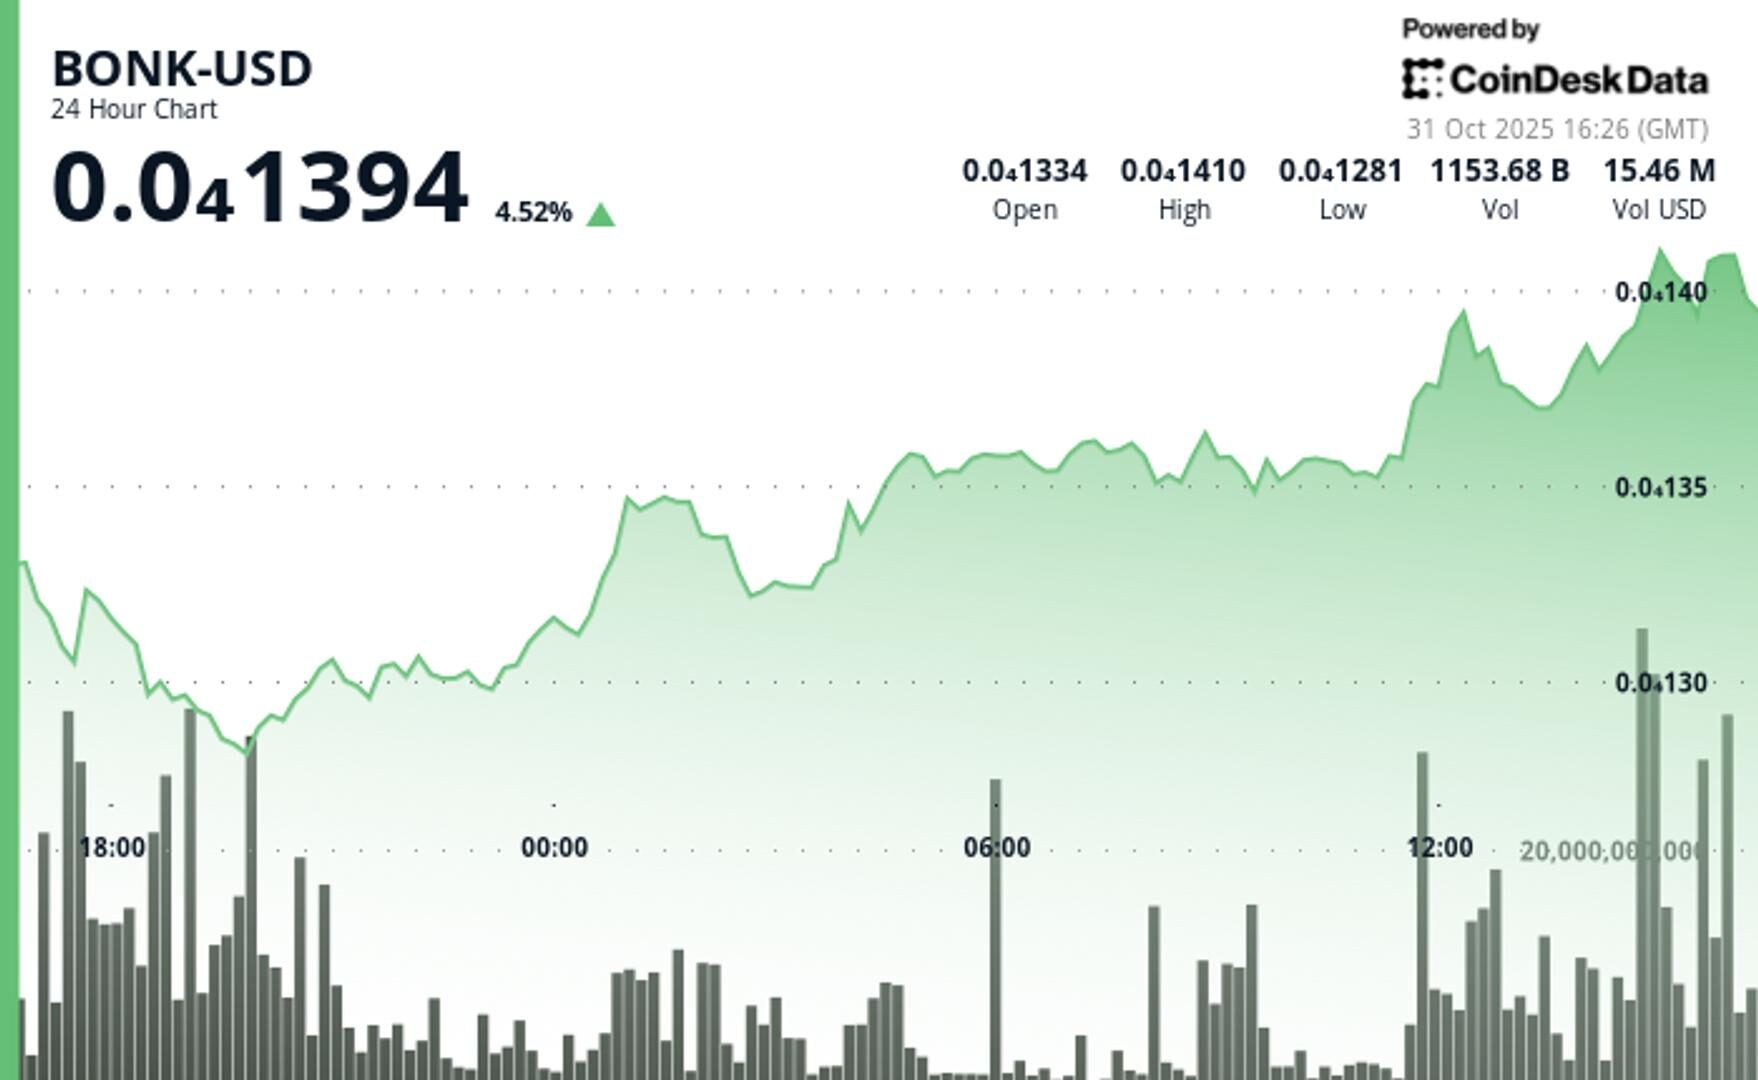
- BONK rose 4.6% to $0.00001394 after clearing key resistance at $0.00001380.
- Volume spiked 67% above average.
- Higher lows and a confirmed breakout suggest momentum continuation.
BONK-USD reversed some of its losses from earlier in the week, rising 4.6% to $0.00001394 in a bullish movement that extended the meme token’s recovery streak. The Solana-based asset built steady upward momentum, marking a breakout above $0.00001380 and printing a new local high near $0.000013968.
The 24-hour trading range tightened between $0.00001281 and $0.00001410, reflecting controlled volatility as the price trended higher through consecutive higher lows, according to CoinDesk Research’s technical analysis data model.
STORY CONTINUES BELOW
Volume jumped 67% above the 24-hour average, reaching 1.15 trillion tokens, confirming strong participation behind the move.
Market sentiment shows signs of shifting toward cautious optimism, with traders eyeing $0.00001400–$0.00001410 as the next resistance band to overcome. The price action remains supported by a defined ascending structure, reinforced by firm buying interest at $0.00001375–$0.00001380, where the breakout began.
If BONK maintains momentum above its recent breakout zone, it could target higher levels in the short term. However, a sustained close below $0.00001380 would risk reintroducing range-bound behavior. With both volatility and volume expanding, BONK’s setup favors continued upside as speculative interest returns to the meme coin segment heading into November.
Disclaimer: Parts of this article were generated with the assistance from AI tools and reviewed by our editorial team to ensure accuracy and adherence to our standards. For more information, see CoinDesk’s full AI Policy.
More For You
Oct 16, 2025

Stablecoin payment volumes have grown to $19.4B year-to-date in 2025. OwlTing aims to capture this market by developing payment infrastructure that processes transactions in seconds for fractions of a cent.
More For You
By Siamak Masnavi, CD Analytics|Edited by Aoyon Ashraf
1 hour ago

A breakout above $550 followed a 1 a.m. UTC volume spike, then price cooled into a $553 to $556 band as traders watched whether $553.50 would hold.
What to know:
- BCH advanced 2.6% to $554.52, breaking above $550 after a push through $547 at 1 a.m. UTC on a 130,078-unit volume burst.
- The model maps $553.50 as first support, with a consolidation band around $553 to $556 and prior levels $547 and $550 now below.
- Trend context shows higher lows from $528.55 and $534.36; immediate checkup sits at the $558.25 prior high.


-
Back to menu
Prices
-
Back to menu
-
Back to menu
Indices -
Back to menu
Research
-
Back to menu
Consensus 2026 -
Back to menu
Sponsored
-
Back to menu
Videos -
Back to menu
-
Back to menu
-
Back to menu
Webinars
Select Language