The sharp move unfolded within a $0.0121 range as price action confirmed a textbook lower-high, lower-low formation.
By Shaurya Malwa, CD Analytics
Updated Nov 13, 2025, 5:18 a.m. Published Nov 13, 2025, 5:17 a.m.

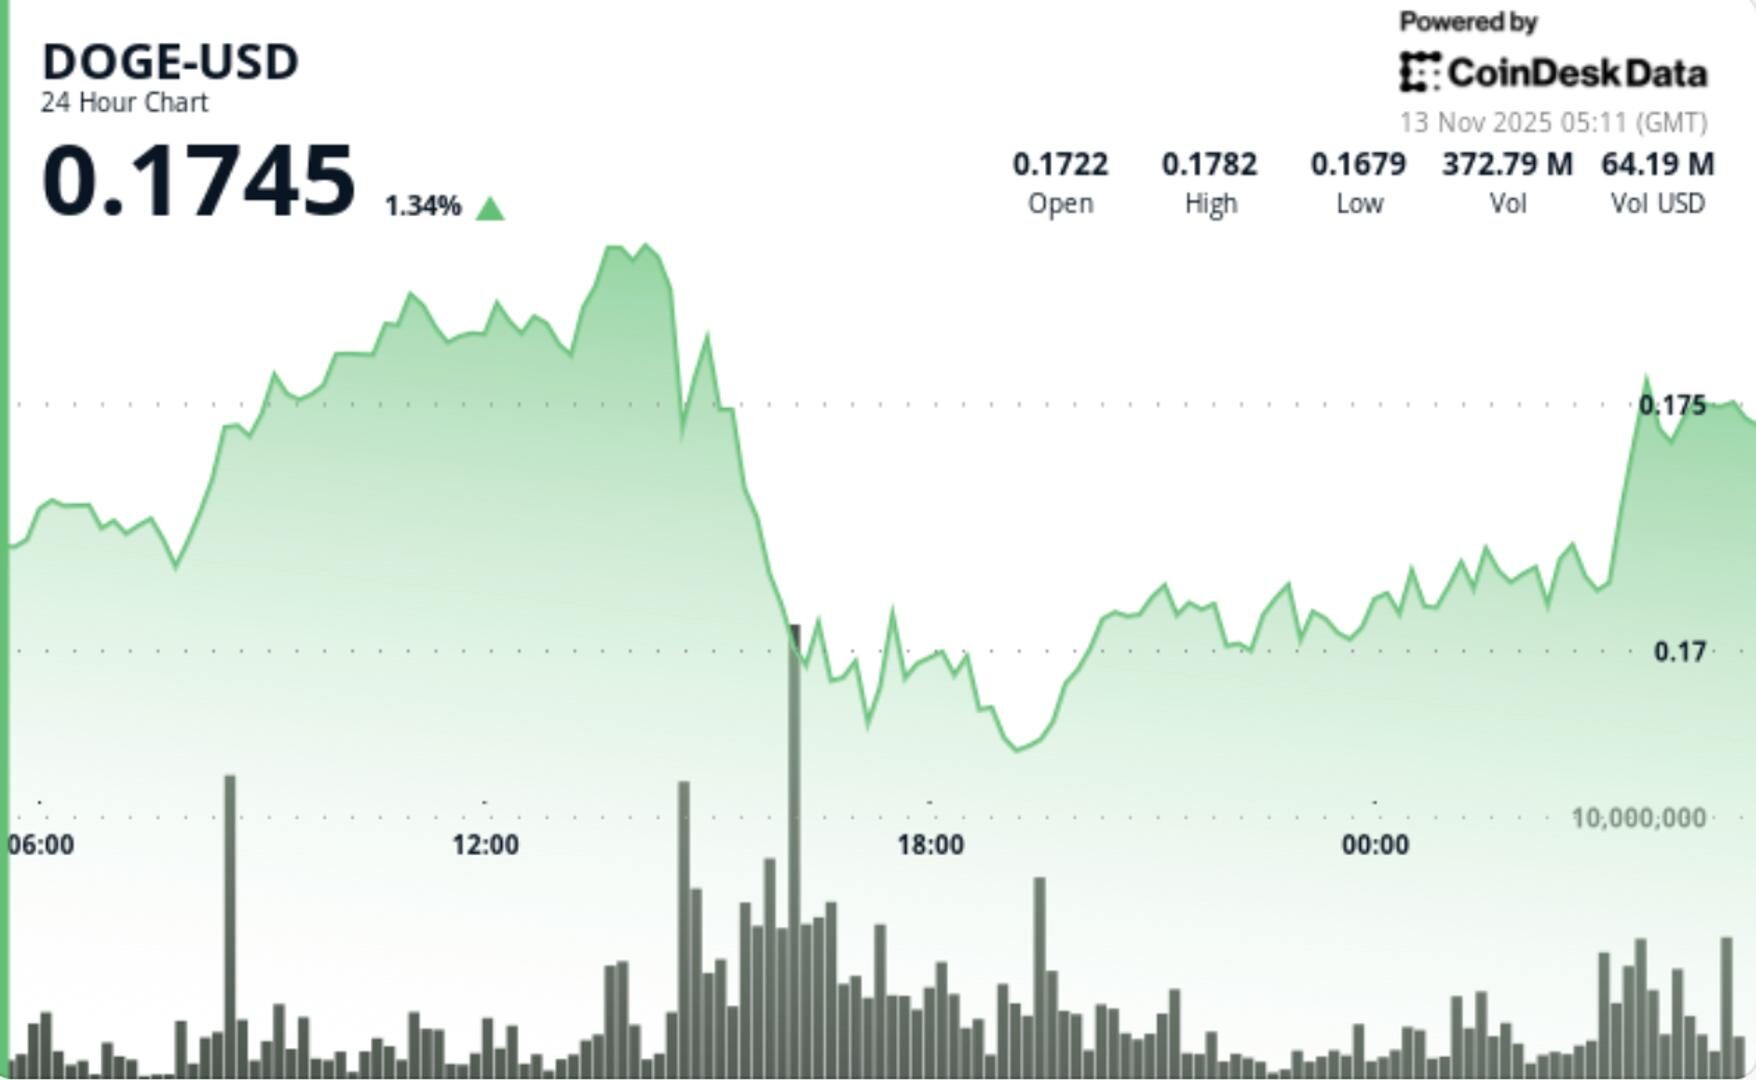
- Dogecoin fell 5.5% to $0.1730 during European trading hours, breaking below the critical $0.1720 level on heavy volume.
- The breakdown was marked by a surge in trading volume to 500.6 million tokens, significantly above the 24-hour average.
- Despite attempts to stabilize, Dogecoin remains vulnerable to further declines without sustained buying support.
The memecoin broke below the critical $0.1720 level on heavy volume as sellers dominated the London session, testing the resilience of long-term technical support.
Dogecoin extended its decline Tuesday, tumbling 5.5% from $0.1831 to $0.1730 as bearish momentum accelerated across European trading hours. The sharp move unfolded within a $0.0121 range as price action confirmed a textbook lower-high, lower-low formation.
STORY CONTINUES BELOW
The breakdown gathered speed at 14:00 GMT, when trading volume exploded to 500.6 million tokens — 77% above the 24-hour average of 283 million. Heavy selling emerged at the $0.1789 resistance zone, triggering a cascade through successive support levels until buyers stabilized the move near $0.1719.
Despite modest stabilization late in the session, DOGE remained pinned near the lows. Attempts to rebound toward $0.1732 met immediate selling pressure, while elevated activity of 12.5 million tokens per hour during the recovery phase suggested distribution rather than accumulation.
DOGE’s session structure reflects deteriorating momentum with declining support strength. The failure to reclaim $0.1789 resistance validates a near-term bearish trend, while compression around $0.1730 highlights uncertainty among short-term traders.
The $0.1719 zone absorbed multiple retests, forming a fragile base that may define the next pivot for directional traders. Volume tapering from peak levels hints at temporary seller exhaustion, but without follow-through buying, the market remains vulnerable to another downside test.
With no major fundamental triggers, price action remains purely technical. DOGE’s breakdown below its short-term moving averages reinforces the broader bearish bias that has persisted since early November. The hourly RSI sits near 38, indicating mildly oversold conditions but not yet capitulation.
Market analyst Kevin (@Kev_Capital_TA) highlights the weekly 200-EMA near $0.16 as Dogecoin’s structural “line in the sand.” That level has held through six previous retests since summer, marking the boundary between cyclical pullback and long-term trend reversal.
A decisive close below $0.17 would shift sentiment decisively bearish, while sustained defense above $0.1720 may allow for a near-term consolidation phase or relief bounce toward $0.1760.
The immediate focus is whether the $0.17 handle can hold under continued pressure. Institutional order-flow metrics suggest systematic de-risking rather than panic liquidation — leaving room for a technical rebound if volume subsides further.
Failure of the $0.1720–$0.1719 support cluster could expose the $0.1650–$0.1600 zone, where the weekly moving average sits as last-ditch structural support.
More For You
Oct 16, 2025

Stablecoin payment volumes have grown to $19.4B year-to-date in 2025. OwlTing aims to capture this market by developing payment infrastructure that processes transactions in seconds for fractions of a cent.
More For You
By CD Analytics, Siamak Masnavi
1 hour ago

Technical breakout drives BCH higher as institutional accumulation emerges above $515 support
What to know:
- BCH climbed from $508.32 to $518.01 on volume 158% above average.
- Breakout pierced $530 resistance before establishing support at $515.
- 60-minute data shows controlled buying above previous resistance levels.


