BTC
$104,855.14
+
0.13%
ETH
$2,511.39
–
0.37%
USDT
$1.0005
+
0.02%
XRP
$2.1496
–
2.10%
BNB
$642.85
–
1.11%
SOL
$145.69
–
1.93%
USDC
$1.0001
+
0.03%
TRX
$0.2702
–
1.90%
DOGE
$0.1679
–
1.20%
ADA
$0.6005
–
3.00%
HYPE
$39.69
–
0.64%
WBT
$48.37
–
0.95%
SUI
$2.7855
–
3.15%
BCH
$463.44
–
0.76%
LINK
$12.88
–
1.84%
LEO
$9.1528
–
0.52%
XLM
$0.2494
–
2.43%
AVAX
$18.43
–
1.40%
TON
$2.8929
–
3.36%
SHIB
$0.0₄1158
–
0.68%
By CD Analytics, Joe Lautzenhiser
Updated Jun 18, 2025, 2:30 p.m. Published Jun 18, 2025, 2:05 p.m.
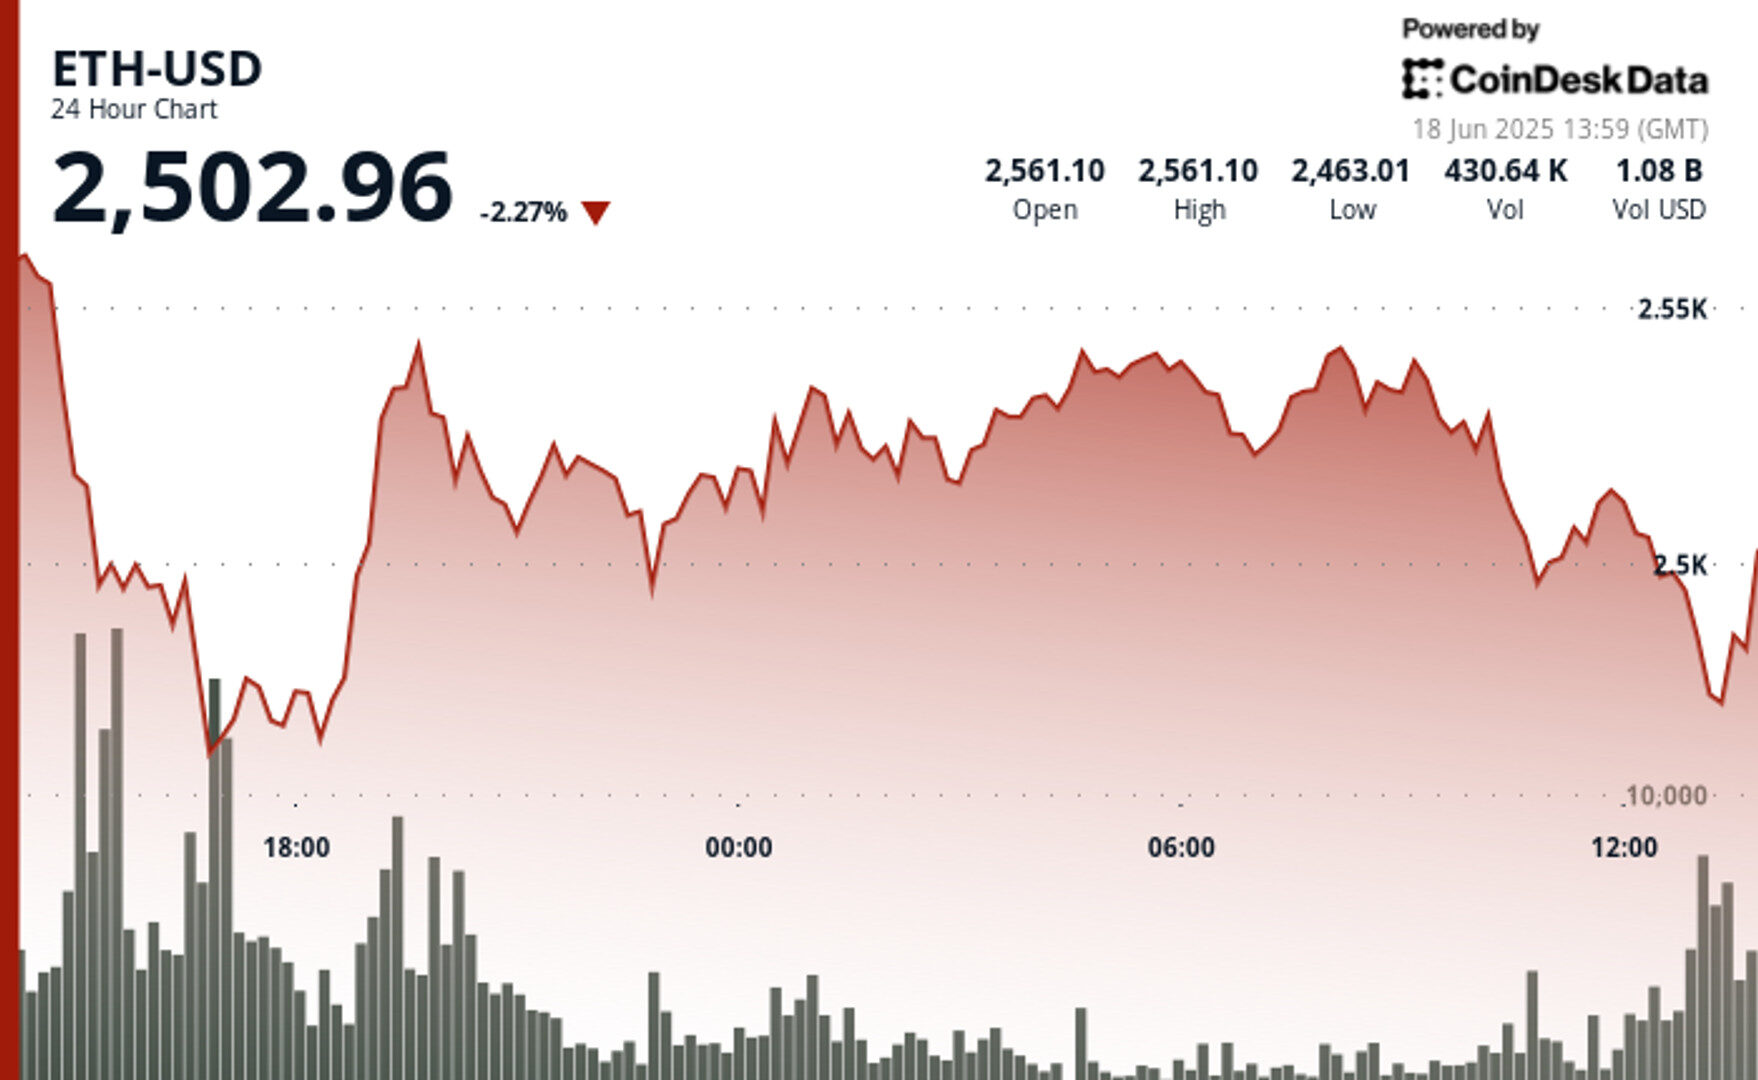
- Escalating tensions between Israel and Iran continue to rattle global markets, with ETH showing resilience at the $2,500 support level despite recent volatility.
- Ethereum experienced a 4.05% trading range ($106.11) over 24 hours, with strong volume support emerging at the $2,470-$2,500 zone establishing a critical technical floor.
- Technical analysts point to a potential “golden cross” forming on Ethereum charts
Ethereum’s price action has formed a consolidation pattern between $2,500-$2,540 with decreasing volume suggesting accumulation rather than distribution.
The cryptocurrency remains trapped below the critical $2,800 resistance level that has acted as a barrier several times in recent weeks, with traders closely watching for a breakout that could trigger renewed momentum toward $3,000.
STORY CONTINUES BELOW
Meanwhile, staking activity has reached record levels with over 35 million ETH now locked, potentially reducing circulating supply as geopolitical uncertainties continue to inject volatility across financial markets.
Technical analysts note that Ethereum may be approaching a potential ‘golden cross’—a bullish signal that occurs when the 50-day moving average rises above the 200-day—an indicator that has historically preceded significant upward trends.
- ETH experienced a 4.05% trading range ($106.11) over 24 hours, with a sharp decline from $2,564.28 to $2,455.95 followed by recovery.
- Strong volume support emerged at the $2,490-$2,500 zone, establishing a critical technical floor that repelled multiple downside tests.
- Price action formed a consolidation pattern between $2,500-$2,540 in the latter half of the period, with decreasing volume suggesting accumulation rather than distribution.
- ETH experienced a significant bullish breakout at 11:43, surging from $2,506 to $2,517 with notably high volume (5,876-8,096 units).
- Selling pressure emerged around $2,515, creating a descending channel culminating in a sharp decline to $2,503 between 12:19-12:22.
- The hourly price action formed a clear V-shaped recovery pattern, with the $2,503-$2,504 zone established as critical short-term support.
Disclaimer: Portions of this article were generated with the assistance of AI tools and reviewed by CoinDesk’s editorial team for accuracy and adherence to our standards. For more information, see CoinDesk’s full AI Policy.
CoinDesk Analytics is CoinDesk’s AI-powered tool that, with the help of human reporters, generates market data analysis, price movement reports, and financial content focused on cryptocurrency and blockchain markets.
All content produced by CoinDesk Analytics is undergoes human editing by CoinDesk’s editorial team before publication. The tool synthesizes market data and information from CoinDesk Data and other sources to create timely market reports, with all external sources clearly attributed within each article.
CoinDesk Analytics operates under CoinDesk’s AI content guidelines, which prioritize accuracy, transparency, and editorial oversight. Learn more about CoinDesk’s approach to AI-generated content in our AI policy.

Joe Lautzenhiser is an editorial and SEO analyst for CoinDesk. Prior to joining CoinDesk, Joe was history teacher and curriculum advisor for Success Academy Charter Schools, the largest charter school network in New York City. He holds BTC and ETH.


