HBAR Consolidates at $0.2010 as Volume Surge Signals Distribution
Hedera faces selling pressure at $0.2055 resistance as trading volume explodes 137% above average, marking institutional distribution amid choppy price action.
By CD Analytics, Oliver Knight
Updated Oct 29, 2025, 4:54 p.m. Published Oct 29, 2025, 4:54 p.m.

- HBAR faces heavy resistance near $0.2055, with a 137% surge in trading volume signaling possible institutional selling and strong distribution pressure at that level.
- Support at $0.1938 remains critical, holding firm through multiple tests, but lower highs ($0.2044, $0.2032, $0.2017) reinforce a bearish short-term trend.
- Despite a temporary boost from the new Nasdaq-listed spot HBAR ETF, momentum has shifted back to sellers as intraday volatility and halted trading point to potential instability.
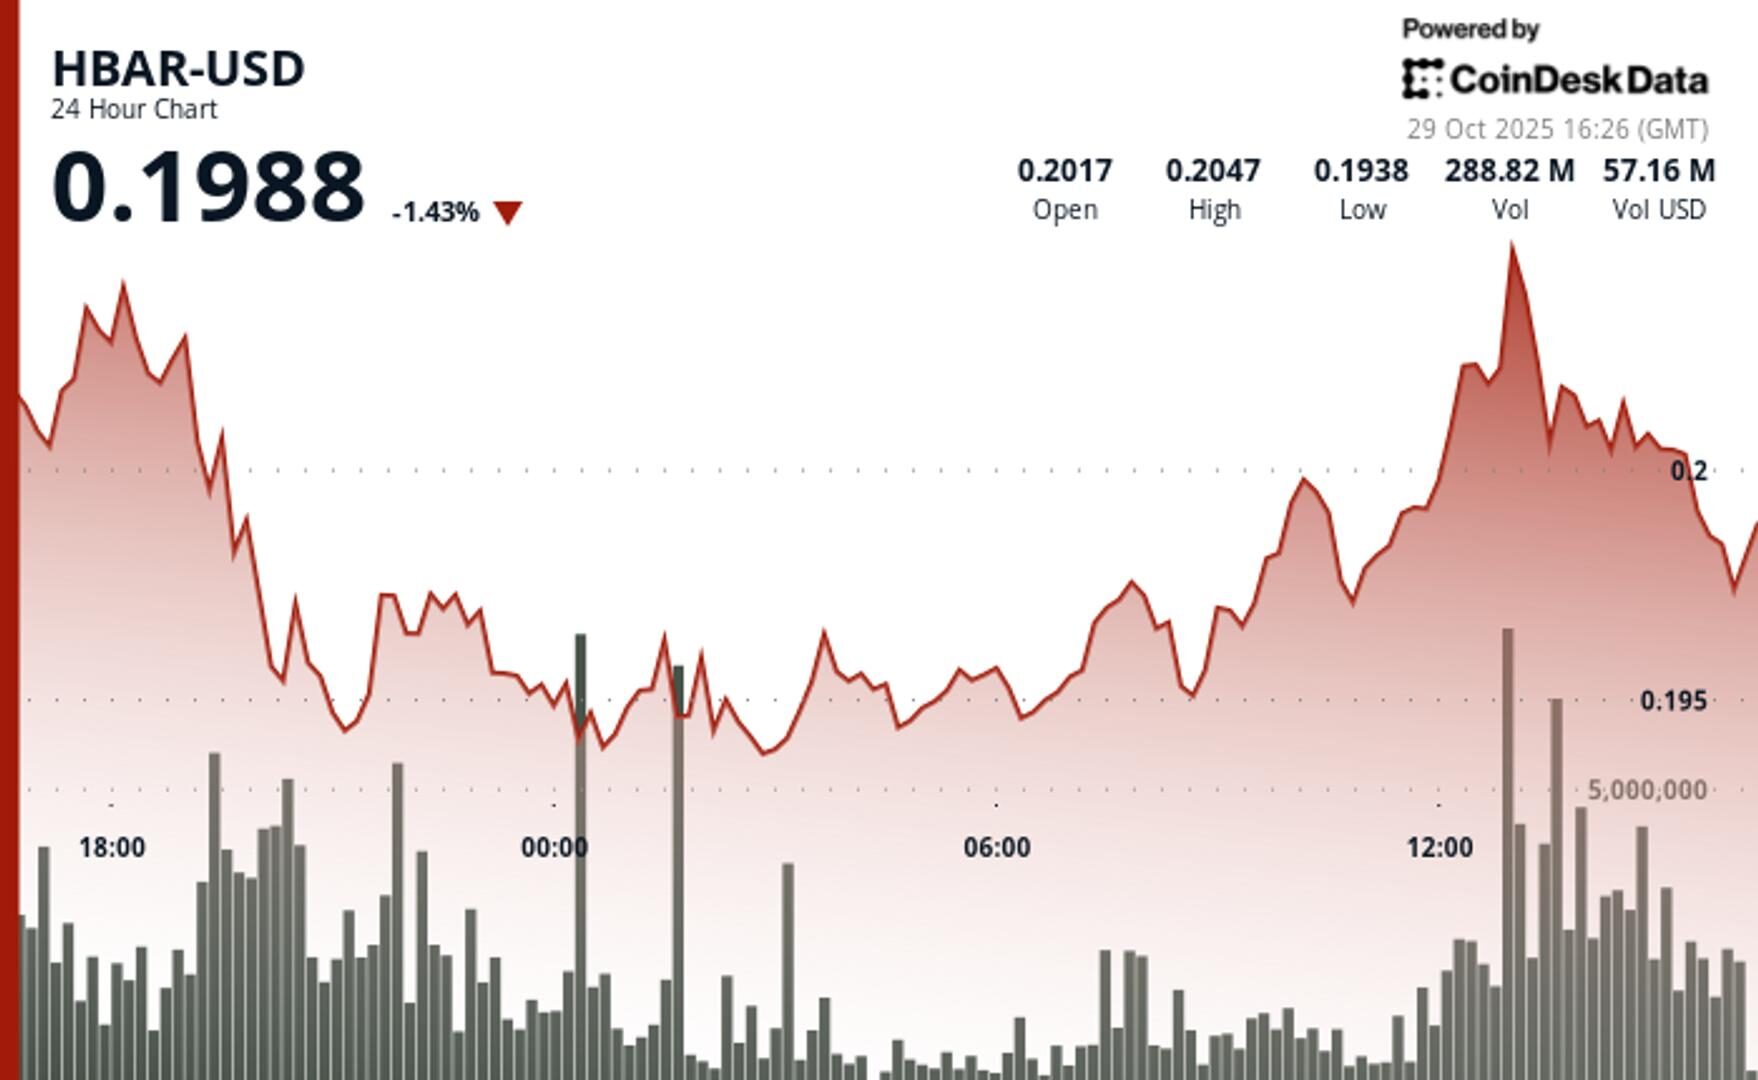
HBAR slipped 0.3% to $0.2010 on Tuesday as sellers reasserted control near key resistance. The token traded within a tight $0.0124 range, fading from a session high of $0.2059 as technical selling capped upside momentum.
A surge in trading volume to 249 million tokens—137% above average—confirmed heavy distribution at the $0.2055 level, suggesting institutional selling. Support at $0.1938 has held through repeated tests, but a series of lower highs at $0.2044, $0.2032, and $0.2017 signals persistent bearish momentum.
STORY CONTINUES BELOW
Intraday volatility intensified between 13:33 and 13:48, with sharp swings from $0.2015 to $0.2029 amid bursts of 20.6 million tokens. Trading abruptly halted at 14:16, pointing to possible market disruption or data issues. The $0.2014 pivot now serves as a key level as traders watch whether HBAR’s $0.1938 support can withstand continued pressure.
The price action follows Tuesday’s launch of a spot HBAR ETF on the Nasdaq, which led to a significant intraday increase in HBAR.

- Support / Resistance
- Key support at $0.1938 has held through multiple tests.
- Strong resistance at $0.2055 remains unbroken after repeated high-volume rejections.
- Volume Analysis
- Recent 249M token volume spike marks a 137% increase over the average.
- Indicates institutional selling pressure and distribution concentrated near resistance.
- Chart Patterns
- Descending trendline confirms bearish momentum with successive lower highs at:
- $0.2044
- $0.2032
- $0.2017
- Price action remains range-bound, but momentum favors sellers.
- Descending trendline confirms bearish momentum with successive lower highs at:
- Targets / Risk-Reward
- Downside target: Break below $0.1938 support could trigger further weakness.
- Upside potential: Recovery faces resistance at $0.2017 and major supply near $0.2055.
Disclaimer: Parts of this article were generated with the assistance from AI tools and reviewed by our editorial team to ensure accuracy and adherence to our standards. For more information, see CoinDesk’s full AI Policy.
More For You
Oct 16, 2025

Stablecoin payment volumes have grown to $19.4B year-to-date in 2025. OwlTing aims to capture this market by developing payment infrastructure that processes transactions in seconds for fractions of a cent.
More For You
By CD Analytics, Francisco Rodrigues|Edited by Jamie Crawley
56 minutes ago

The decline was part of a broader crypto market drop, with traders focusing on technical cues and selling dominating
What to know:
- BNB’s price dropped 2.7% to $1,105 after a brief rise following BNB Chain’s largest-ever quarterly token burn, which removed 1.44 million BNB from circulation.
- The decline was part of a broader crypto market drop, with traders focusing on technical cues and selling dominating.
- Despite the short-term bearish trend, a report from Binance founder’s family office YZi Labs framed BNB as a long-term structural asset.


-
Back to menu
Prices
-
Back to menu
-
Back to menu
Indices -
Back to menu
Research
-
Back to menu
Consensus 2026 -
Back to menu
Sponsored
-
Back to menu
Videos -
Back to menu
-
Back to menu
-
Back to menu
Webinars
Select Language