HBAR Declines 4% Following ETF Debut as Initial Euphoria Fades
-
News
-
Video
-
Consensus 2026
-
Data & Indices
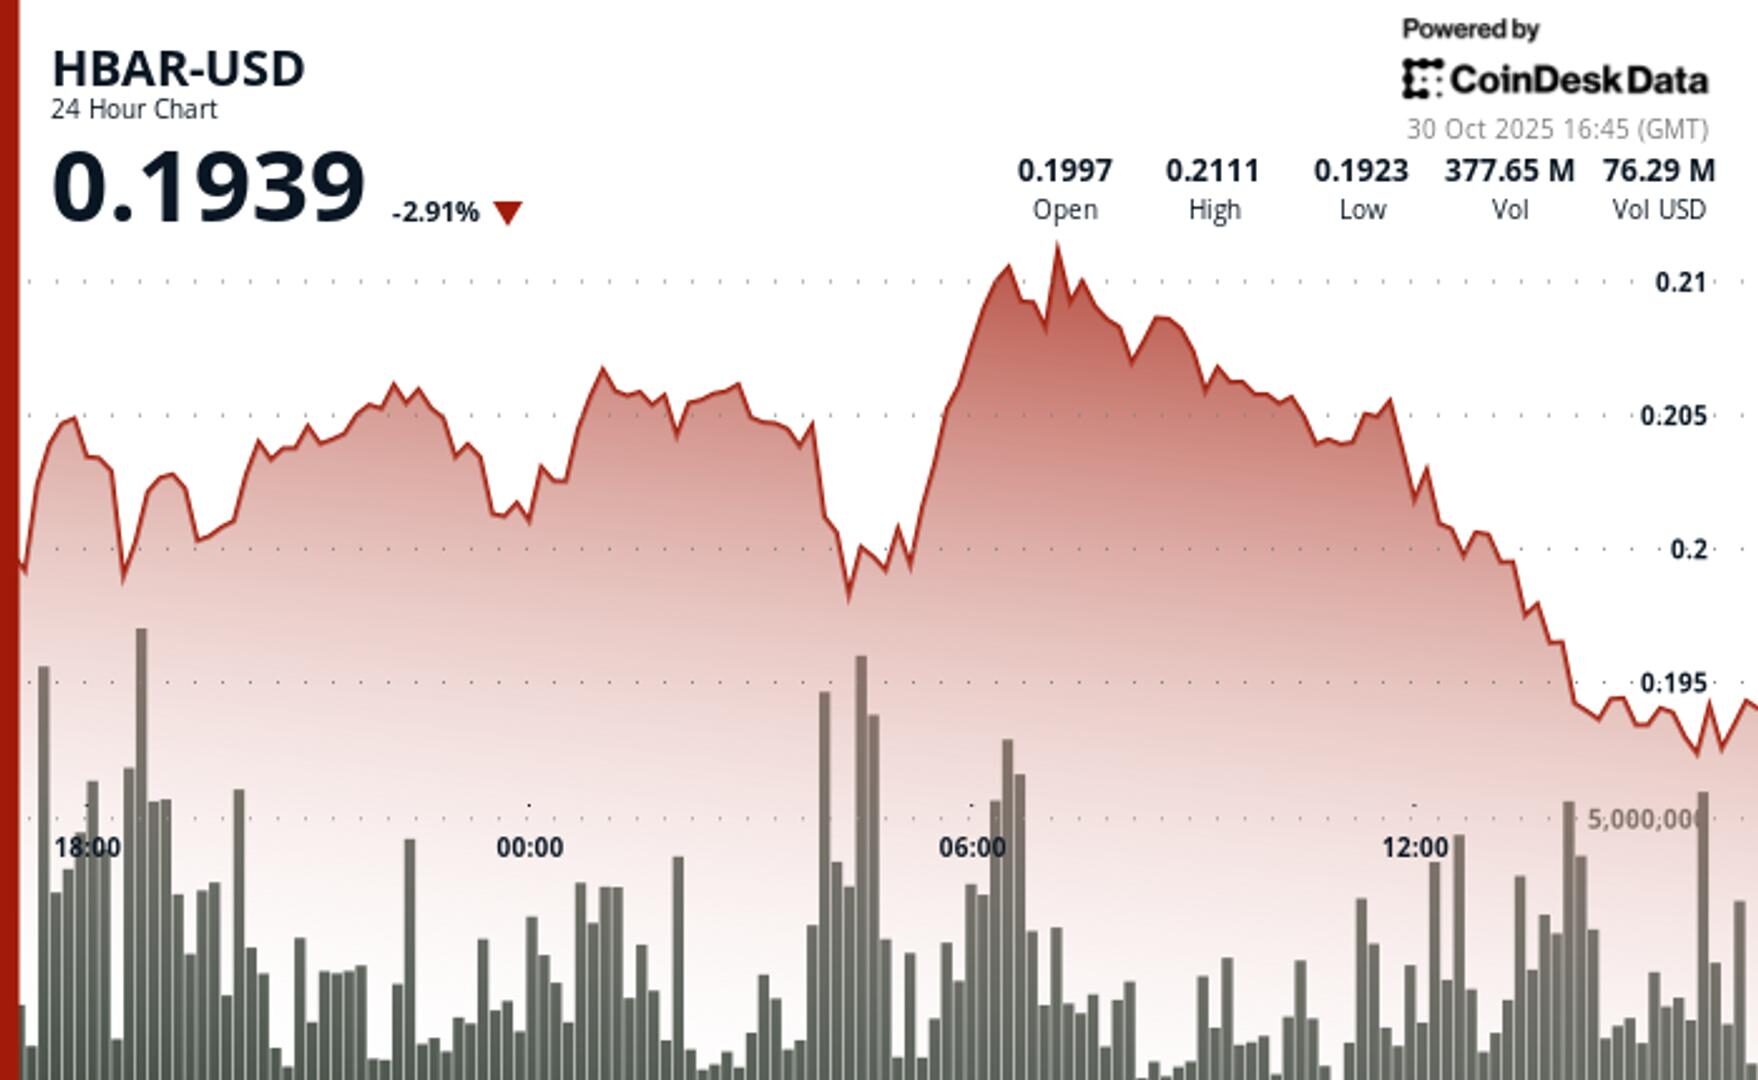
Hedera retreated to $0.1925 despite historic spot ETF launch on Nasdaq as profit-taking offset institutional milestone.
By CD Analytics, Oliver Knight
Updated Oct 30, 2025, 5:13 p.m. Published Oct 30, 2025, 5:13 p.m.

- HBAR fell 3.25% to $0.1925 despite the debut of Canary Capital’s spot HBAR ETF on Nasdaq, highlighting a disconnect between institutional milestones and short-term price action.
- Trading volume jumped 19% above the 30-day average, suggesting increased institutional activity and profit-taking after an initial 25% post-announcement rally.
- Technical weakness dominated fundamentals, with key support breaks confirming a bearish shift and signaling potential short-term downside despite long-term adoption momentum.
Hedera’s native token, HBAR, fell 3.25% to $0.1925 over the 24-hour period ending October 30, despite the launch of its first U.S.-listed exchange-traded fund.
The selloff followed Canary Capital’s spot HBAR ETF debut on the Nasdaq, a milestone for non-Bitcoin digital assets.
STORY CONTINUES BELOW
The token initially rallied more than 25% after the announcement, but enthusiasm quickly faded as profit-taking set in. The ETF, trading under the ticker HBR, recorded about $8 million in first-day volume, underscoring solid institutional interest despite short-term price weakness.
While the ETF marked a regulatory and institutional breakthrough for Hedera, technical factors overshadowed fundamentals. HBAR broke through key support levels, confirming bearish momentum and triggering accelerated selling pressure.
Market data suggests the decline was part of a broader pattern of controlled selling across digital assets. Elevated trading volumes, nearly 20% above normal levels, indicate that larger players may have been locking in profits from the ETF-driven rally.

Support/Resistance
- Critical support at $0.2040 broke during the 24-hour period.
- New resistance formed in the $0.2070–$0.2080 zone after multiple rejections.
Volume Analysis
- Strong selling pressure with 261.2M tokens traded, 87% above the 24-hour average.
- Most significant volume activity occurred on 30 October at 04:00 as price broke key technical levels.
Chart Patterns
- Bearish trend established with successive lower highs from the $0.2114 peak.
- Total range of $0.0203 (9.9%); price collapsed from $0.194 to $0.192 amid massive volume spikes.
Targets & Risk/Reward
- 60-minute analysis indicates further downside toward $0.190.
- Momentum indicators show severely oversold conditions, confirming accelerated institutional selling.
Disclaimer: Parts of this article were generated with the assistance from AI tools and reviewed by our editorial team to ensure accuracy and adherence to our standards. For more information, see CoinDesk’s full AI Policy.
More For You
Oct 16, 2025

Stablecoin payment volumes have grown to $19.4B year-to-date in 2025. OwlTing aims to capture this market by developing payment infrastructure that processes transactions in seconds for fractions of a cent.
More For You
19 minutes ago

BTC’s losses follow positive developments in U.S.-China trade relations.
What to know:
- BTC has penetrated the critical 200-day SMA support.
- The dollar index has hit its highest since Aug. 1.
- BTC’s losses follow positive developments in U.S.-China trade relations.


-
Back to menu
Prices
-
Back to menu
-
Back to menu
Indices -
Back to menu
Research
-
Back to menu
Consensus 2026 -
Back to menu
Sponsored
-
Back to menu
Videos -
Back to menu
-
Back to menu
-
Back to menu
Webinars
Select Language