Hedera’s HBAR token saw a dramatic 5% intraday swing as institutional investors drove heavy volatility, with early gains erased by late-session corporate liquidation pressure.
By CD Analytics, Oliver Knight
Updated Oct 16, 2025, 4:40 p.m. Published Oct 16, 2025, 4:40 p.m.

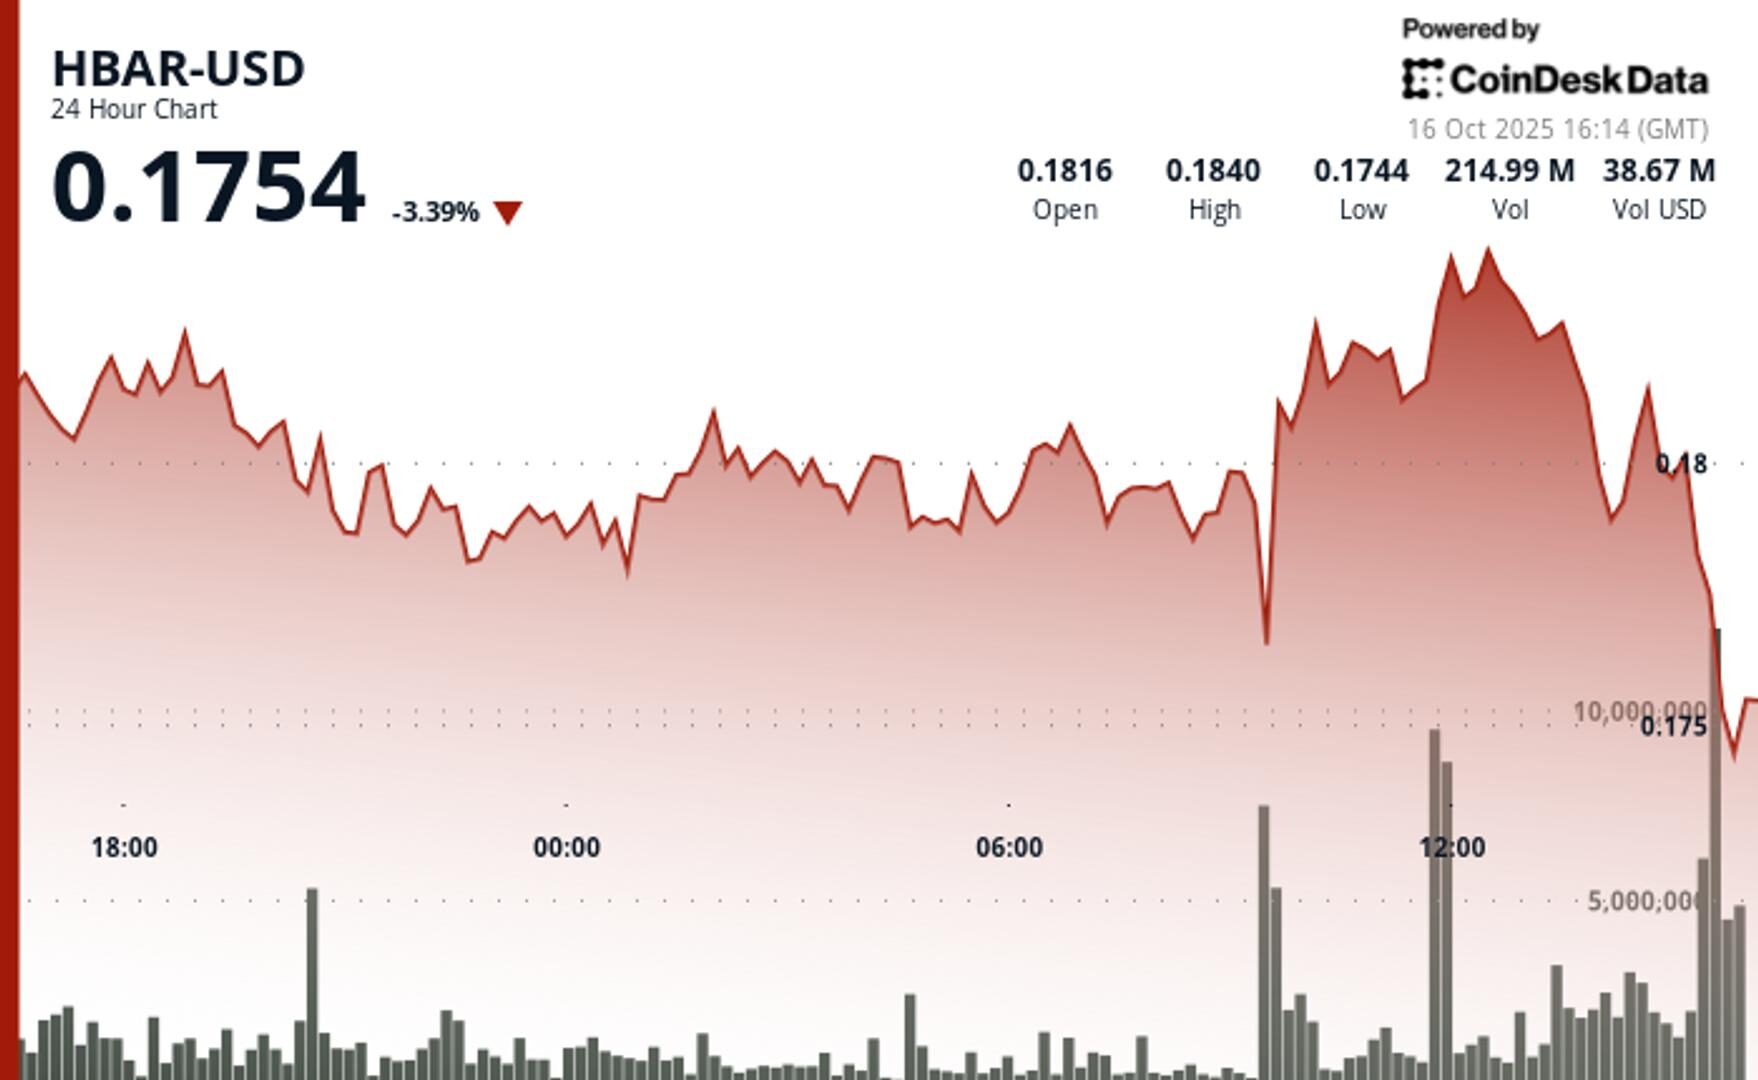
- 5% enterprise price range: HBAR traded between $0.176 and $0.185 from Oct. 15–16, showing heightened institutional activity and profit-taking.
- Heavy corporate volume: Trading exceeded 129 million during morning hours before a steep sell-off hit in the final 60 minutes.
- Support and resistance tested: Key support formed at $0.176–$0.178, while resistance near $0.183–$0.185 capped the rebound.
HBAR endured a volatile 24-hour stretch as institutional traders managed a narrow but intense range between $0.176 and $0.185. The token initially fell on corporate profit-taking before rebounding strongly during morning hours on Oct. 16, when enterprise trading volumes surged above 129 million.
Despite this recovery, the momentum proved short-lived. A sharp reversal struck in the final hour of trading, when corporate sell pressure overwhelmed earlier support zones. Between 14:02 and 14:04, volumes spiked above 3 million as HBAR slid from $0.183 to $0.1805, reflecting aggressive liquidation activity.
STORY CONTINUES BELOW
Analysts say the move highlights shifting institutional sentiment toward enterprise blockchain assets. While HBAR’s corporate base demonstrated resilience at the $0.176–$0.178 range, sustained resistance at $0.183–$0.185 suggests mounting caution among institutional investors.
Overall, the pattern underscores a market caught between profit-taking and structural rebalancing, as corporate participants recalibrate exposure to blockchain-linked tokens amid growing volatility.

- Institutional trading range of $0.01 representing 5% spread between $0.18 enterprise low and $0.19 corporate high.
- Key corporate support zone identified at $0.18-$0.18 levels with multiple institutional buying interest instances.
- Enterprise resistance levels materialized near $0.18-$0.19 range during corporate recovery phase.
- Volume surge exceeding 129 million during 09:00-12:00 window indicating significant institutional corporate participation.
- Final hour corporate volume spike above 3 million suggesting enterprise institutional liquidation pressure.
- Corporate market exhaustion evidenced by zero institutional volume in final trading minutes.
Disclaimer: Parts of this article were generated with the assistance from AI tools and reviewed by our editorial team to ensure accuracy and adherence to our standards. For more information, see CoinDesk’s full AI Policy.
More For You
Oct 10, 2025

Combined spot and derivatives volumes fell 17.5% in September, continuing a four-year seasonal trend
What to know:
- Trading activity falls 17.5% in September slowdown: Combined spot and derivatives volumes dropped to $8.12 trillion, marking the first decline after three months of growth. September has now seen reduced trading volume for the fourth consecutive year.
- Open interest reaches record high despite derivatives market share decline: Total open interest surged 3.2% to $204 billion and peaked at an all-time high of $230 billion during the month.
- Altcoins on CME outperform as Bitcoin and Ether futures decline: While CME’s total derivatives volume stayed flat at $287 billion (-0.08%), SOL futures jumped 57.1% to $13.5 billion and XRP futures rose 7.19% to $7.84 billion. BTC and ETH futures fell 4.05% and 17.9% respectively.
More For You
By CD Analytics, Oliver Knight
1 minute ago

WisdomTree introduces Europe’s first physically-backed Stellar exchange-traded product amid heightened competition in digital payments infrastructure.
What to know:
- LM fluctuated between $0.32 and $0.33 from Oct. 15–16, with heavy intraday swings reflecting fragile market sentiment.
- WisdomTree debuted Europe’s first physically backed Stellar Lumens ETP, broadening regulated investor access.
- Emerging fintech platforms like Digitap are pressuring legacy blockchain payment networks such as Stellar and Ripple.


