-
Back to menu
Prices
-
Back to menu
-
Back to menu
Indices -
Back to menu
Research
-
Back to menu
Events -
Back to menu
Sponsored
-
Back to menu
Videos -
Back to menu
-
Back to menu
-
Back to menu
Webinars
Select Language
Hedera’s token rebounded after testing key support levels, with easing sell pressure and growing enterprise adoption pointing toward renewed upside momentum.
By CD Analytics, Oliver Knight
Updated Sep 2, 2025, 1:12 p.m. Published Sep 2, 2025, 1:12 p.m.

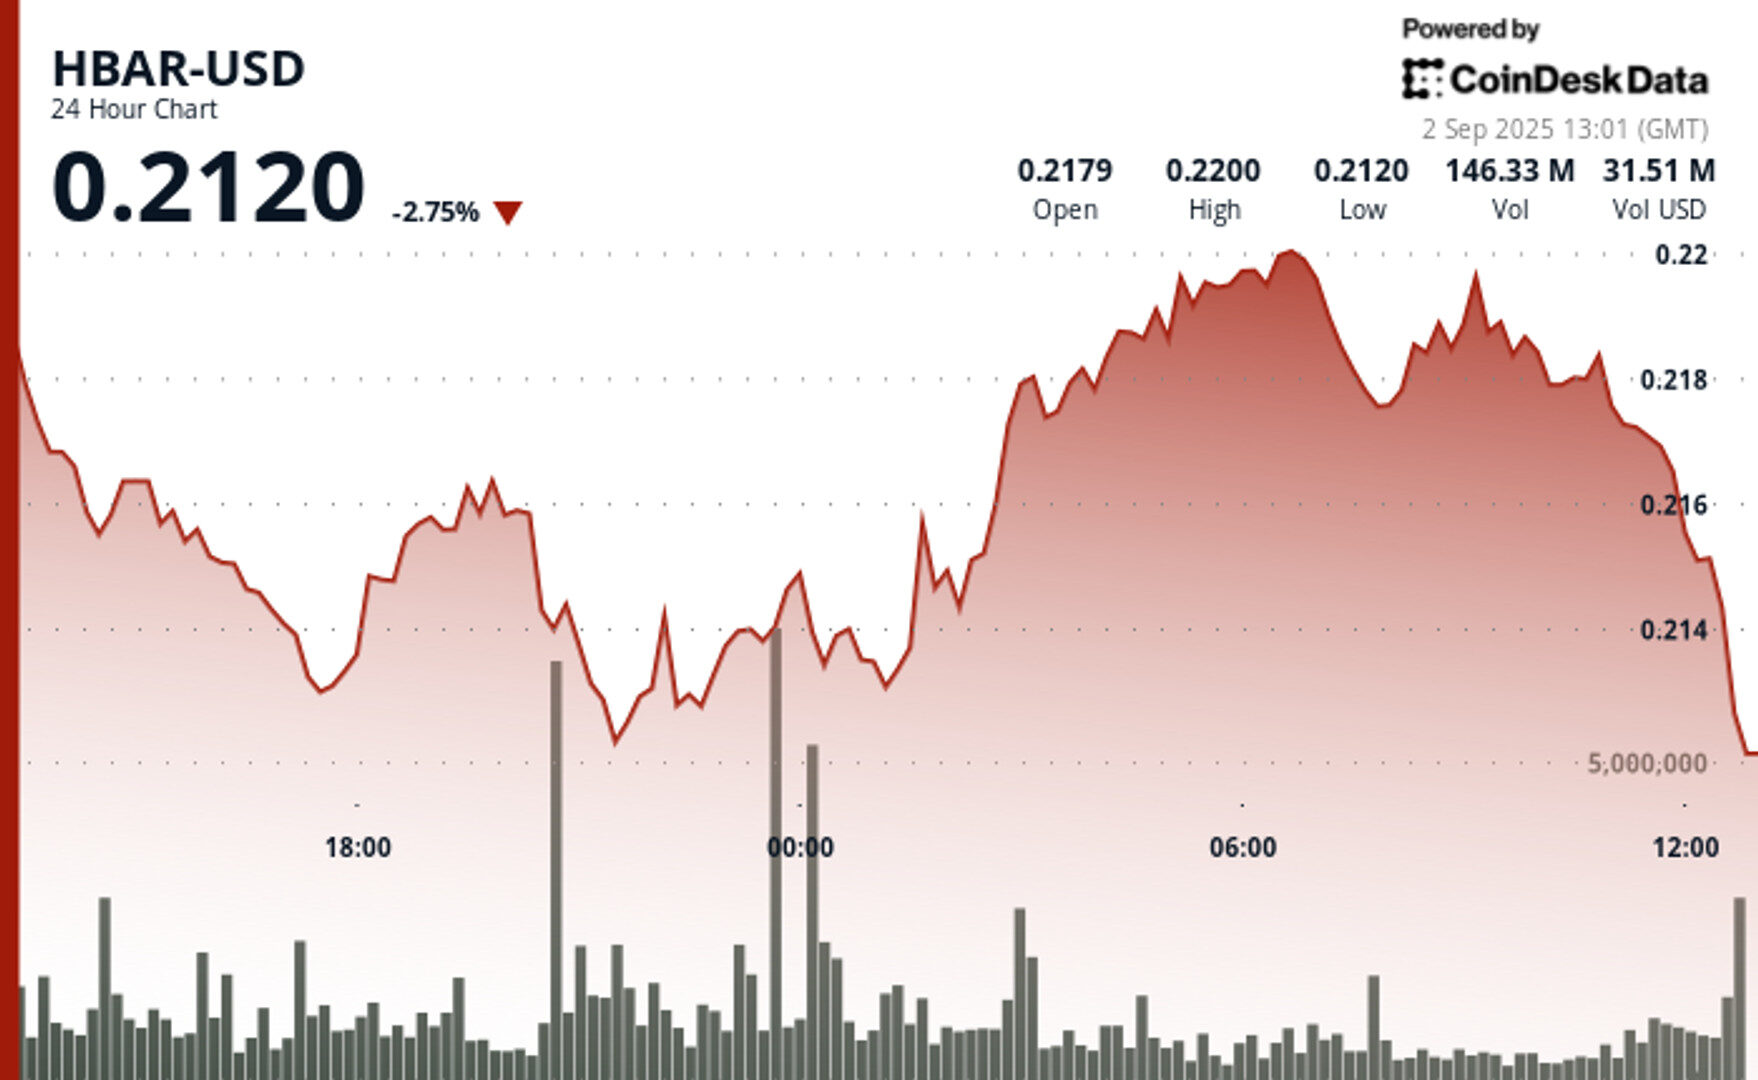
- HBAR swung 6% intraday between $0.21 and $0.22, recovering after a sharp sell-off.
- Liquidations peaked above 79 million before tapering off, suggesting fading bearish pressure.
- Hedera’s enterprise partnerships and focus on real-world blockchain use cases strengthen its long-term outlook.
HBAR saw heightened volatility over the 24-hour period from Sept. 1, 09:00 to Sept. 2, 08:00, trading within a $0.013 range that marked a 6% intraday swing between $0.21 and $0.22.
The token initially slipped from $0.22 down to support at $0.21, weighed by a surge in liquidation volumes that spiked above 79 million. However, as selling pressure subsided, HBAR mounted a recovery, closing the session back near the $0.22 level.
STORY CONTINUES BELOW
Market activity suggested that bearish momentum lost steam once the $0.21 level was tested, with declining volumes on the rebound signaling a potential shift toward sustained upward momentum.
The trading action underscores a near-term technical structure where resilience at key support levels has kept bullish prospects intact.
The emphasis on real-world applications is positioning Hedera and other enterprise-focused blockchains at the forefront of investor attention. Alongside Hedera, projects such as Kaspa and Remittix are building momentum by targeting scalability and cross-border payments, respectively.
With payments innovation resurging as a driver of crypto adoption, Hedera’s corporate alliances and technological architecture put it in a strong position to benefit from the market’s pivot toward utility-driven blockchain infrastructure.

Technical Indicators Assessment
- Trading bandwidth of $0.013 representing 6 per cent differential from session nadir of $0.21 to apex of $0.22.
- Volume surges exceeding 79 million during initial decline phase.
- Critical support threshold examined near $0.21 before recuperation.
- Diminishing liquidation pressure in concluding trading hours.
- Recovery momentum elevating prices towards $0.22 resistance.
- Exhaustion of bearish impetus indicated by volume patterns.
Disclaimer: Parts of this article were generated with the assistance from AI tools and reviewed by our editorial team to ensure accuracy and adherence to our standards. For more information, see CoinDesk’s full AI Policy.
More For You
By CD Analytics, Francisco Rodrigues|Edited by Sheldon Reback
20 minutes ago

The rebound from support was fueled by above-average activity and a clean break above nearby resistance could shift sentiment.
What to know:
- BNB’s price was little changed at $850 after dropping to around $840 and then rallying to $855.
- Buying interest emerged at the $840-$845 support zone.
- The rebound from support was fueled by above-average activity and a clean break above nearby resistance could shift sentiment.
- The token is now consolidating, with resistance near $855-$857, and a hold above current levels could set the stage for a test of higher levels.


