By CD Analytics, Oliver Knight
Updated Oct 14, 2025, 3:43 p.m. Published Oct 14, 2025, 3:43 p.m.

- HBAR flashed a bullish double-bottom pattern near the $0.18 support level, signaling a potential trend reversal after a 9% intraday swing.
- Trading volume surged above 6.3 million during key reversal minutes (13:37–13:46 UTC), confirming strong buying interest at discounted levels.
- Despite broader market uncertainty, HBAR’s rebound suggests renewed momentum and resilience, supported by institutional accumulation and technical strength.
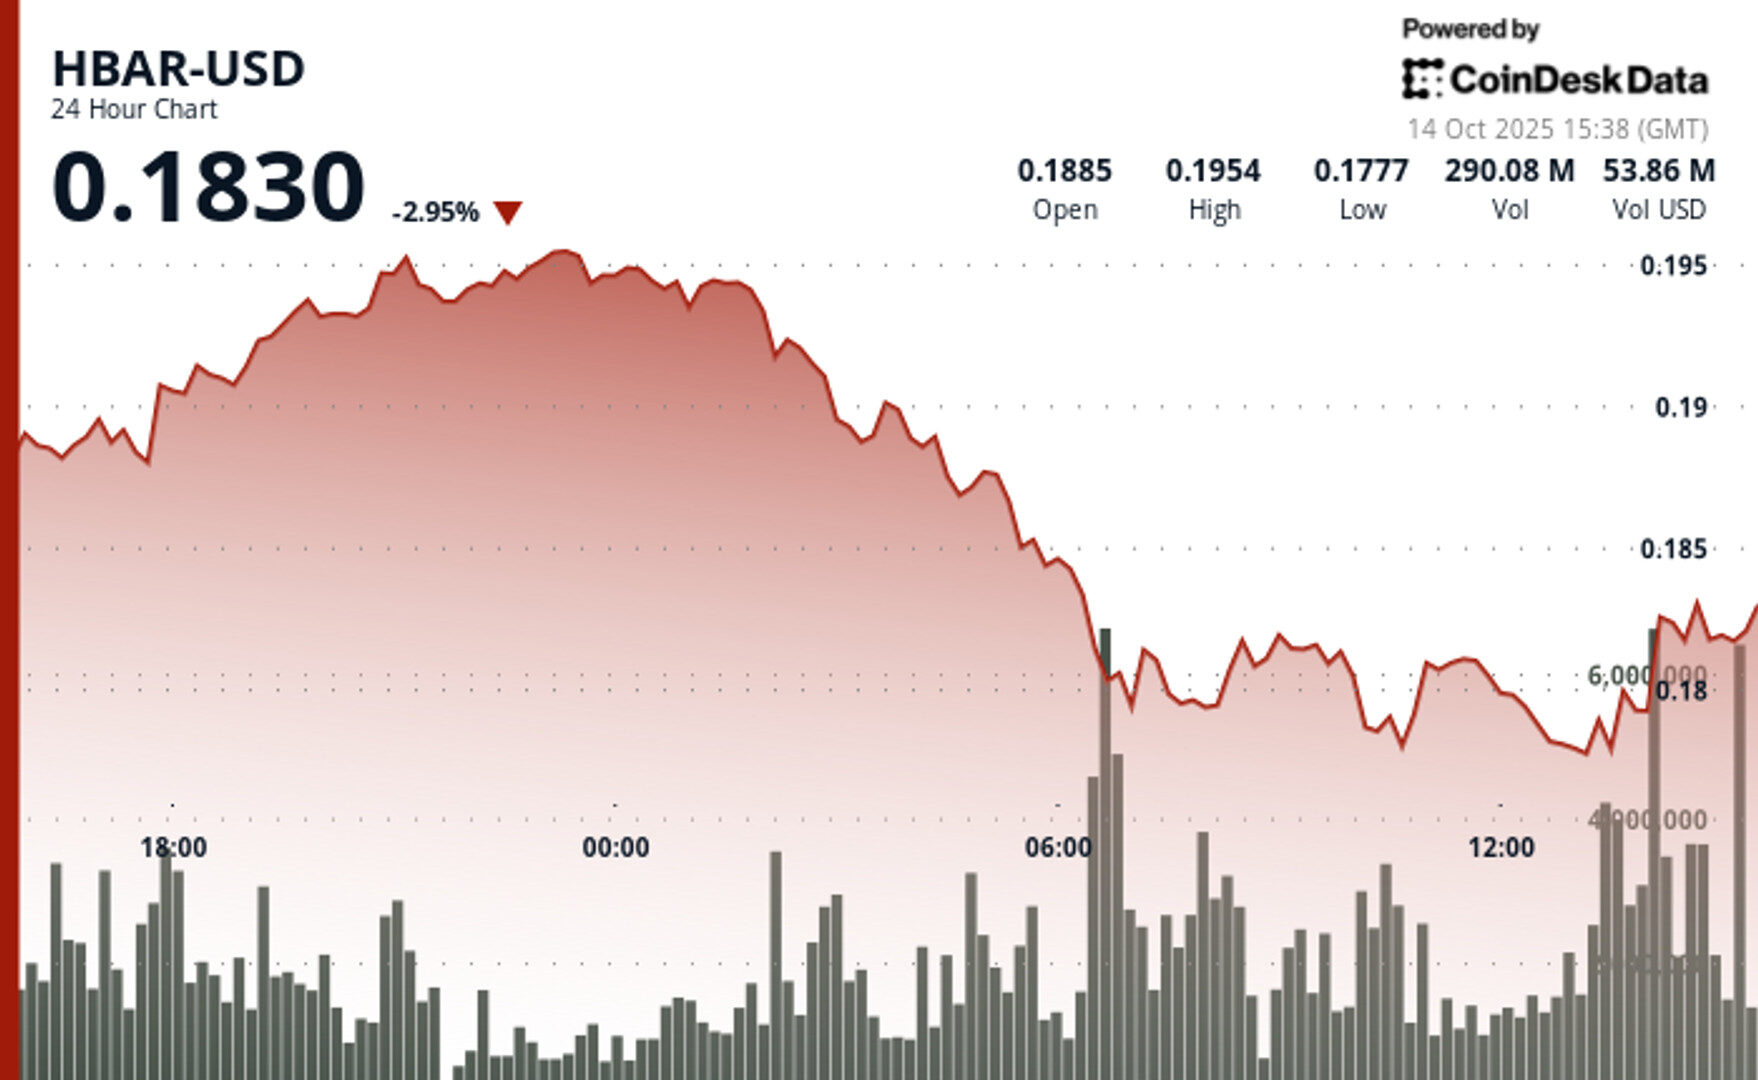
HBAR posted significant volatility over the 24-hour period ending Oct. 14, swinging nearly 9% as traders navigated sharp market fluctuations.
The token dipped from $0.19 to a low near $0.18 before mounting a late recovery that lifted prices back to the $0.18 zone. The most decisive reversal occurred in the final hour of trading, where HBAR rallied 1% from support, buoyed by a surge in volume that topped 6.3 million trades.
STORY CONTINUES BELOW
The sharp uptick in activity between 13:37 UTC and 13:46 UTC suggested strong accumulation as investors stepped in at discounted levels. Chart data indicated a clear double-bottom formation within the $0.18 range — a technical signal often associated with bullish reversals.
The breakout that followed pierced short-term resistance levels, hinting at renewed momentum and potential continuation toward higher price targets.
Despite broader market turbulence driven by ongoing geopolitical and trade tensions, HBAR demonstrated resilience.
The rebound underscores persistent institutional interest in blockchain assets, even as traditional markets experience heightened volatility. With buying pressure intensifying and technical indicators flashing recovery signals, HBAR’s recent price action suggests the token may be positioning for additional near-term gains.
- HBAR formed resistance near $0.20-$0.20 levels before transitioning into sustained downtrend.
- High volume of 174.69 million during 06:00 hour on 14 October validated bearish momentum.
- Double-bottom formation emerged around $0.18-$0.18 support levels.
- Volume surge exceeded 6.30 million during 13:37-13:46 period signaling buying interest.
- Overall range of $0.02 represents substantial 9% swing highlighting heightened volatility.
- Critical support established at $0.18-$0.18 range determining near-term directional bias.
Disclaimer: Parts of this article were generated with the assistance from AI tools and reviewed by our editorial team to ensure accuracy and adherence to our standards. For more information, see CoinDesk’s full AI Policy.
More For You
Sep 9, 2025
Combined spot and derivatives trading on centralized exchanges surged 7.58% to $9.72 trillion in August, marking the highest monthly volume of 2025
What to know:
- Combined spot and derivatives trading on centralized exchanges surged 7.58% to $9.72 trillion in August, marking the highest monthly volume of 2025
- Gate exchange emerged as major player with 98.9% volume surge to $746 billion, overtaking Bitget to become fourth-largest platform
- Open interest across centralized derivatives exchanges rose 4.92% to $187 billion
More For You
By Helene Braun, AI Boost|Edited by Nikhilesh De
23 minutes ago

The investment bank initiated coverage of Circle with an “Outperform” rating.
What to know:
- William Blair initiated coverage on Circle (CRCL) with an “Outperform” rating, calling it the most important company in the stablecoin ecosystem.
- The bank sees Circle’s USDC as a potential replacement for fiat in cross-border B2B payments, a market valued at up to $24 trillion.
- Circle’s long-term growth hinges on commercial USDC adoption, with new infrastructure like CPN and Arc aimed at expanding use beyond crypto trading.


