-
Back to menu
Prices
-
Back to menu
-
Back to menu
Indices -
Back to menu
Research
-
Back to menu
Events -
Back to menu
Sponsored
-
Back to menu
Videos -
Back to menu
-
Back to menu
-
Back to menu
Webinars
Select Language
By CD Analytics, Oliver Knight
Updated Aug 15, 2025, 3:28 p.m. Published Aug 15, 2025, 3:26 p.m.

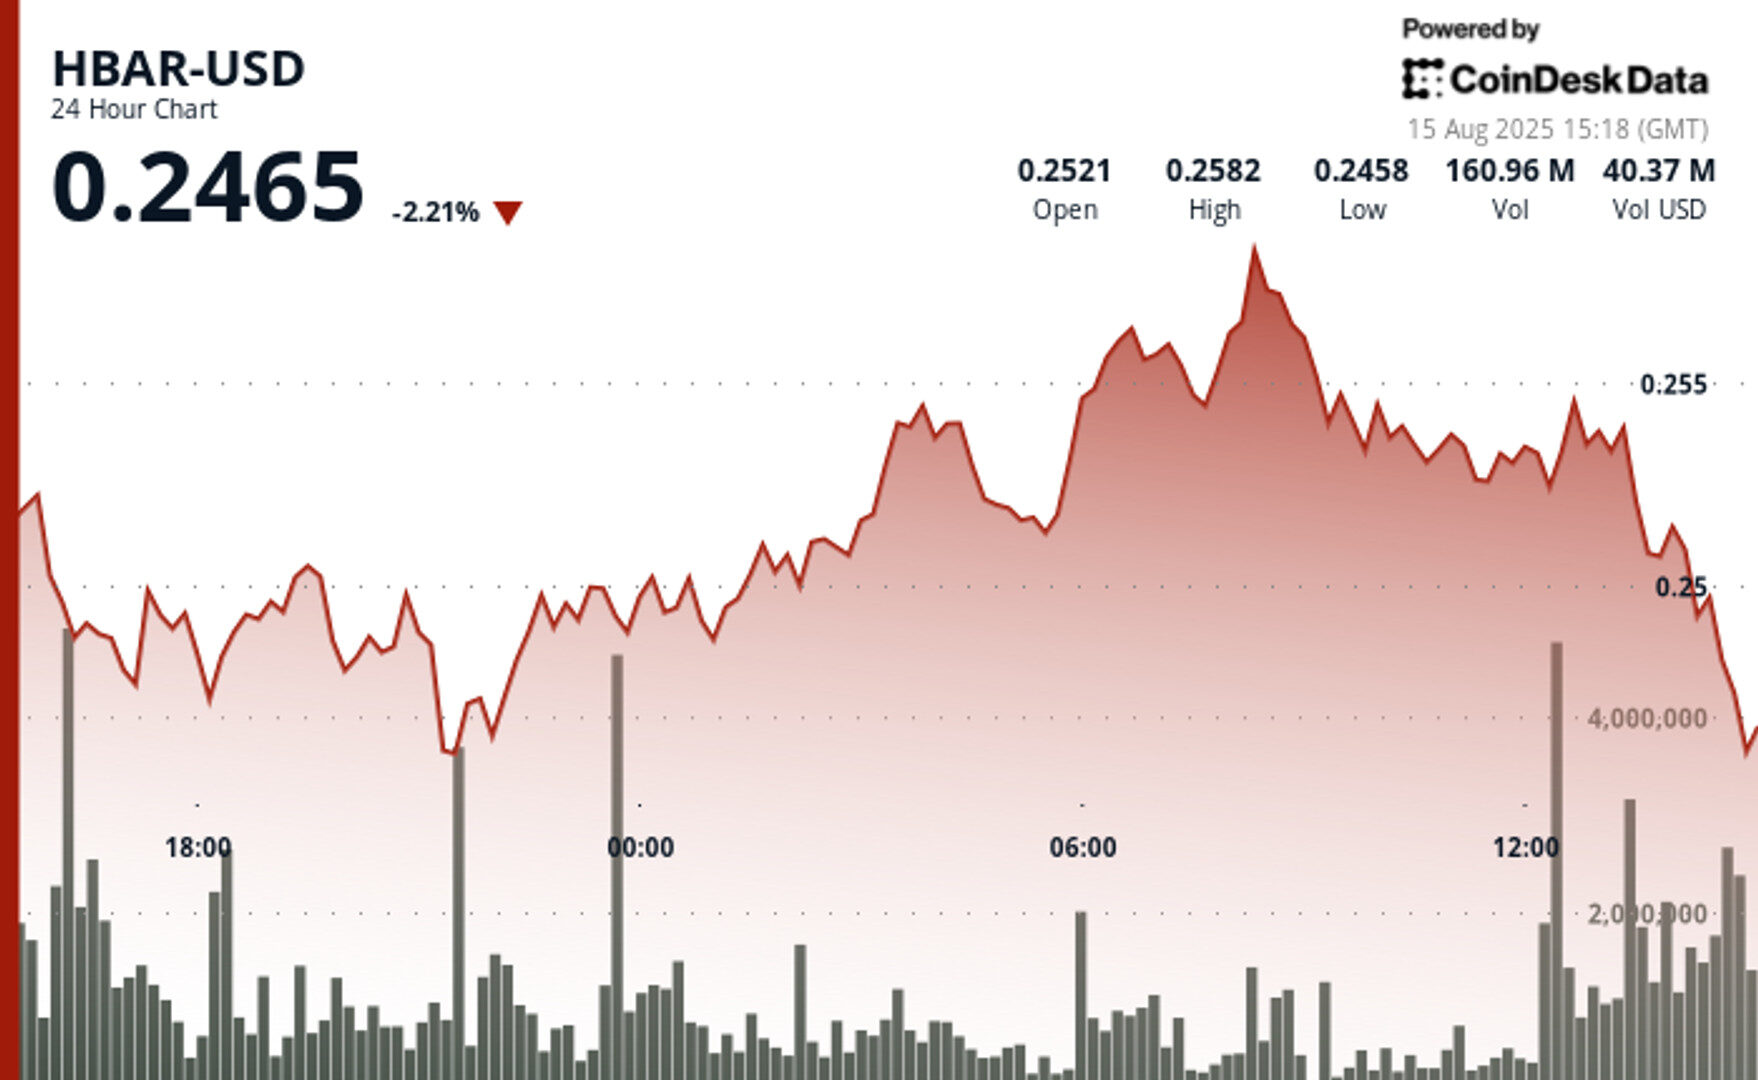
- HBAR traded between $0.244 and $0.259 over 24 hours, with key support at $0.248–$0.249 and resistance at $0.255–$0.256.
- Volume spiked to 65.56 million during a recovery rally, suggesting systematic accumulation before profit-taking set in.
- Grayscale’s ETF trust filings and Binance’s cross-chain support highlight institutional adoption despite short-term market turbulence.
HBAR posted sharp price swings over the 24 hours between Aug. 14 at 15:00 and Aug. 15 at 14:00, moving within a $0.015 range, a 6% gap between the day’s high of $0.259 and low of $0.244.
The token faced heavy selling pressure early in the session, bottoming at $0.244 around 21:00 on Aug. 14 before staging a strong rebound to $0.259 by 08:00 the following morning.
STORY CONTINUES BELOW
Trading volumes hit 65.56 million during the recovery, well above the 24-hour average, underscoring strong participation.
Key support formed between $0.248 and $0.249, where buyers repeatedly stepped in.
On the upside, resistance solidified at $0.255–$0.256 as sellers intensified distribution. The climb from overnight lows showed solid momentum with volume backing, hinting at systematic accumulation.
However, the subsequent pullback to $0.251 reflected profit-taking near resistance and pointed to potential short-term consolidation.
Broader market sentiment added to the volatility. Grayscale filed for Delaware trust registrations for potential HBAR and Cardano spot ETFs, using a structure familiar from previous crypto investment products.
Meanwhile, Binance expanded BNB Smart Chain functionality to include HBAR and SUI, enabling more efficient cross-chain transactions and increasing retail accessibility. These developments signaled strengthening institutional interest even as near-term price action wavered.

- Trading range of $0.015 representing 6% differential between $0.259 peak and $0.244 trough during 24-hour period.
- Critical support threshold established at $0.248-$0.249 where buying interest emerged systematically.
- Resistance zone materialised around $0.255-$0.256 where distribution pressure intensified substantially.
- Volume surge to 65.56 million during recovery peak at $0.259 exceeded 24-hour moving average significantly.
- Breakdown below $0.252 support confirmed by elevated volume exceeding 5 million during final trading hour.
- Institutional distribution pattern evident during 13:35-13:45 timeframe with acute price deterioration.
Disclaimer: Parts of this article were generated with the assistance from AI tools and reviewed by our editorial team to ensure accuracy and adherence to our standards. For more information, see CoinDesk’s full AI Policy.
CoinDesk Analytics is CoinDesk’s AI-powered tool that, with the help of human reporters, generates market data analysis, price movement reports, and financial content focused on cryptocurrency and blockchain markets.
All content produced by CoinDesk Analytics is undergoes human editing by CoinDesk’s editorial team before publication. The tool synthesizes market data and information from CoinDesk Data and other sources to create timely market reports, with all external sources clearly attributed within each article.
CoinDesk Analytics operates under CoinDesk’s AI content guidelines, which prioritize accuracy, transparency, and editorial oversight. Learn more about CoinDesk’s approach to AI-generated content in our AI policy.

Oliver Knight is the co-leader of CoinDesk data tokens and data team. Before joining CoinDesk in 2022 Oliver spent three years as the chief reporter at Coin Rivet. He first started investing in bitcoin in 2013 and spent a period of his career working at a market making firm in the UK. He does not currently have any crypto holdings.

More For You
By Krisztian Sandor, James Van Straten|Edited by Stephen Alpher
35 minutes ago

The crypto rally continues to quickly reverse course just two days after bitcoin surged to a new record and ether soared to a five-year high.
What to know:
- Digital asset treasury firms experienced significant sell-offs as the crypto rally lost momentum.
- Strategy (MSTR) fell 3%, down 33% from its November 2024 high. Ether-focused BMNR, SBET posted bigger losses.
- The move coincided with bitcoin and ether sharply reversing from big moves higher less than two days ago.


