Hedera Tumbles 4% as Altcoins Continue to Suffer

HBAR Drops 4% to $0.1247 as Afternoon Selloff Breaks Support

Markets

Share this article

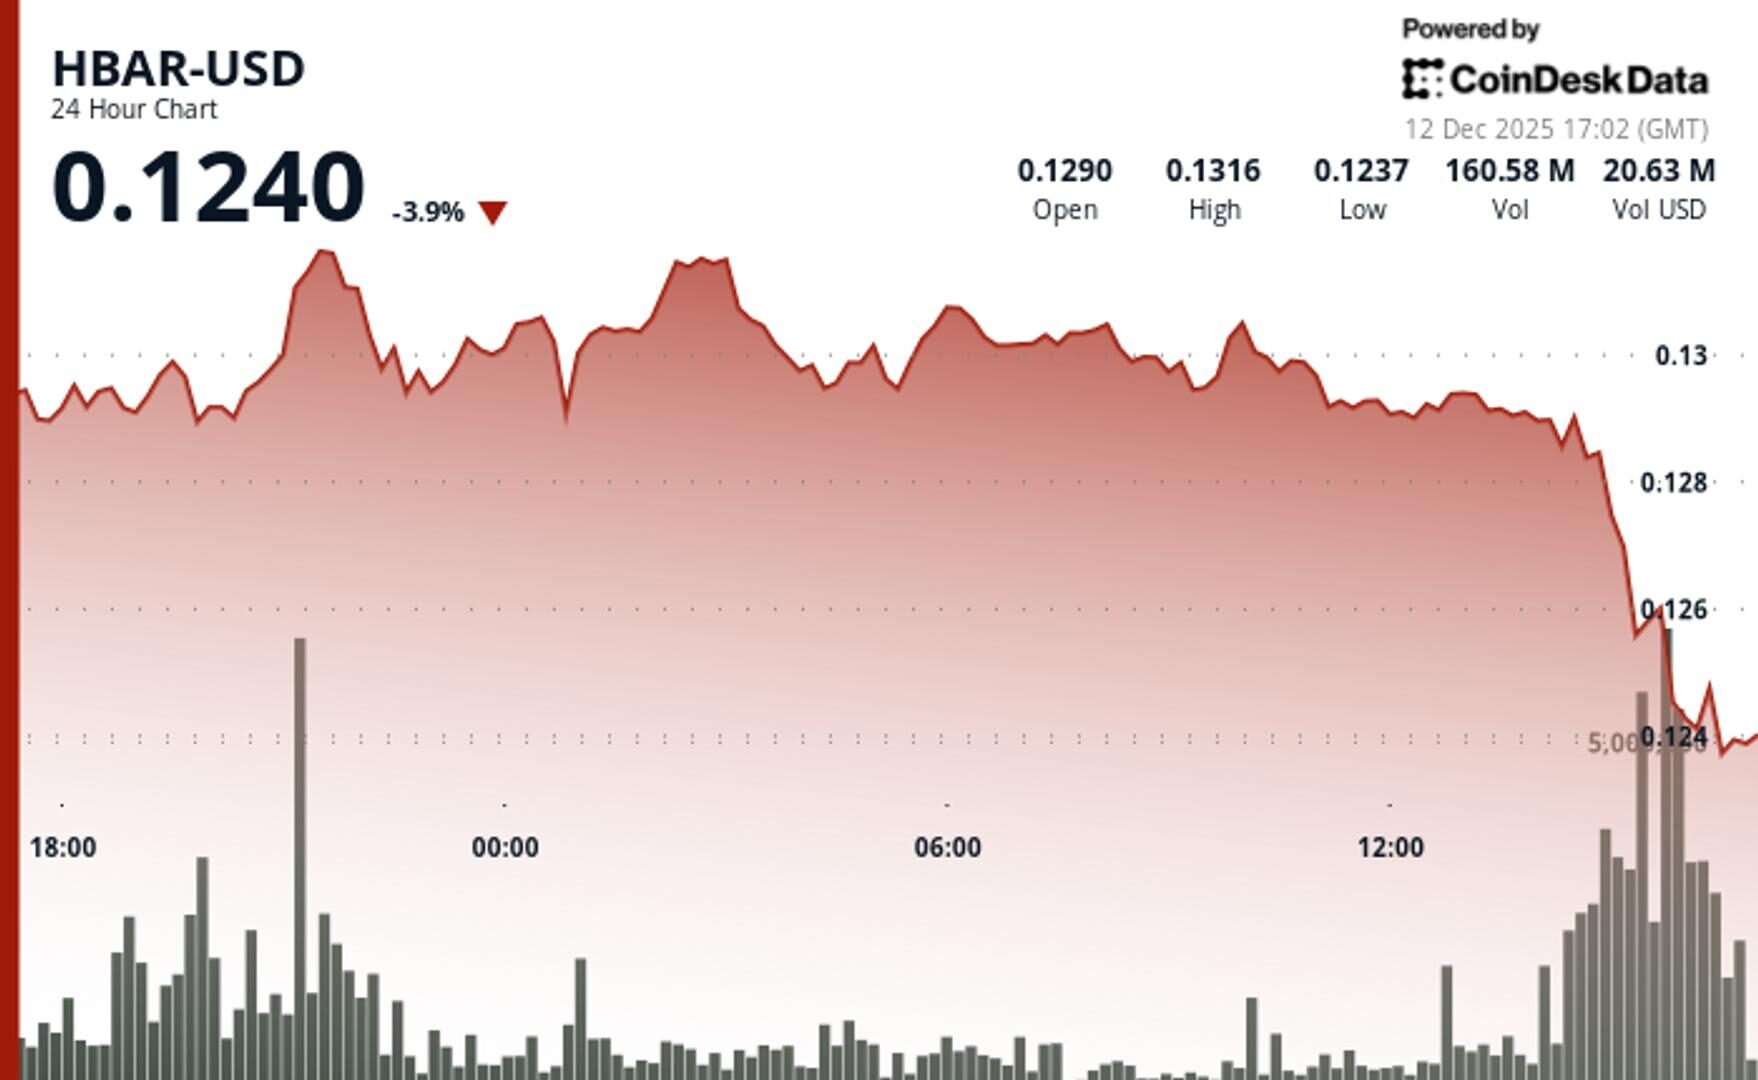
Hedera’s native token retreated from resistance levels as institutional volume surged during key reversal hour.

By CD Analytics, Oliver Knight

Updated Dec 12, 2025, 5:14 p.m. Published Dec 12, 2025, 5:14 p.m.

"HBAR price chart showing a 4% drop to $0.1247 amid an afternoon selloff and increased institutional volume."
  • HBAR dropped from $0.1291 to $0.1247, breaking critical support on exceptional volume.
  • Flash crash occurred at 15:00 UTC with 175% above-average trading activity.
  • Token stabilized near $0.1235 as buyers emerged at technical support levels.

HBAR trades lower Thursday after breaking through multiple technical levels during an afternoon selloff that pushed the token down 4% to $0.1247.

The native token of the Hedera network posts a $0.0082 range representing 6.4% volatility as resistance at $0.1320 proves insurmountable for bulls attempting to extend gains.

STORY CONTINUES BELOW

Don’t miss another story.Subscribe to the Crypto Daybook Americas Newsletter today.See all newslettersBy signing up, you will receive emails about CoinDesk products and you agree to ourterms of useandprivacy policy.

Volume patterns reveal heightened institutional participation throughout the session. The surge in trading activity confirms genuine price discovery rather than low-liquidity movements characteristic of smaller altcoins.

The afternoon cascade establishes a clear lower high pattern from the initial Dec. 11 spike, creating deteriorating market structure that accelerates downward momentum through previously established support zones.

Technical levels at $0.1235 become paramount as HBAR tests critical support following rejection at $0.1320 resistance.

The stabilization pattern around $0.124-$0.125 following dramatic capitulation creates potential for mean reversion back to $0.126 resistance.

Traders remain cautious given the decisive break of higher timeframe support levels and exceptional volume during the decline that indicates conviction selling. This limits near-term upside potential despite the immediate price recovery that brings some relief to bulls.

HBAR/USD (TradingView)

Support/Resistance:

  • Immediate support established at $0.1235 following afternoon decline.
  • Strong resistance confirmed at $0.1320 after multiple rejection attempts.
  • New trading range between $0.123-$0.125 on 60-minute timeframes.

Volume Analysis:

  • Exceptional surge to 165.9 million tokens (175% above 24-hour average) during key reversal.
  • 60-minute flash crash volume peaked at 15.7 million (700% above hourly average).
  • Sustained above-average activity confirming institutional participation.

Chart Patterns:

  • Lower highs pattern established from Dec. 11 peak creating bearish structure.
  • Flash crash and recovery formation suggesting accumulation near support.
  • Deteriorating momentum through multiple support levels indicating trend shift.

Targets & Risk/Reward:

  • Immediate upside target at $0.126 mean reversion level.
  • Downside risk to $0.123 support floor if current consolidation fails.
  • Key resistance remains $0.1285 where initial breakdown occurred.

Disclaimer: Parts of this article were generated with the assistance from AI tools and reviewed by our editorial team to ensure accuracy and adherence to our standards. For more information, see CoinDesk’s full AI Policy.

More For You

By CoinDesk Research

Nov 14, 2025

GP Basic Image

What to know:

  • As of October 2025, GoPlus has generated $4.7M in total revenue across its product lines. The GoPlus App is the primary revenue driver, contributing $2.5M (approx. 53%), followed by the SafeToken Protocol at $1.7M.
  • GoPlus Intelligence’s Token Security API averaged 717 million monthly calls year-to-date in 2025 , with a peak of nearly 1 billion calls in February 2025. Total blockchain-level requests, including transaction simulations, averaged an additional 350 million per month.
  • Since its January 2025 launch , the $GPS token has registered over $5B in total spot volume and $10B in derivatives volume in 2025. Monthly spot volume peaked in March 2025 at over $1.1B , while derivatives volume peaked the same month at over $4B.

More For You

By CD Analytics, Will Canny|Edited by Oliver Knight

51 minutes ago

"Polkadot price chart showing a 2.5% drop from $2.02 to $1.97 with increased trading volume."

The Polkadot token erased earlier gains amid elevated volume, falling from a high of $2.09 to $1.97.

What to know:

  • DOT collapsed through ascending trendline support around the $2.05 level on a massive 284% volume surge.
  • The token broke decisively below the support level to trade 2% lower over the last 24 hours.


Sign In 

Leave a Reply

Your email address will not be published. Required fields are marked *