Chainlink (LINK) Price News: Declines 2% as ETF News Fails to Break Resistance
-
News
-
Video
-
Consensus 2026
-
Data & Indices
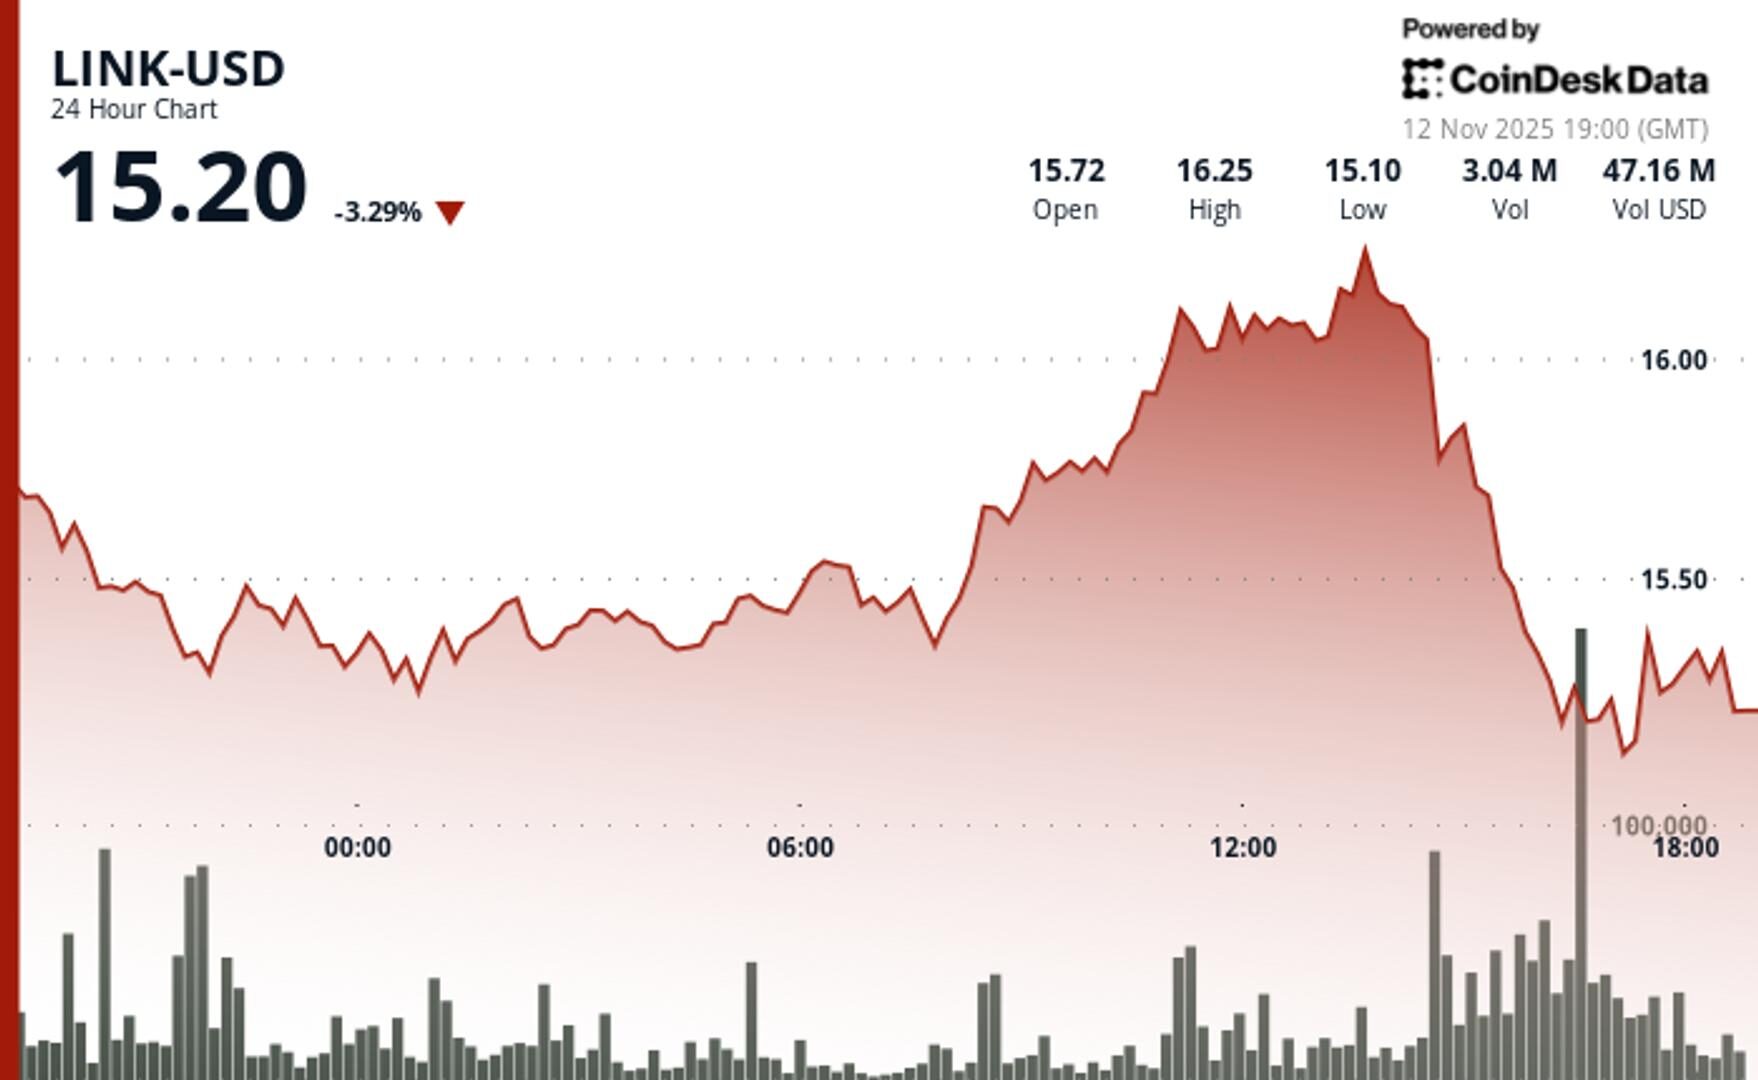
The oracle token encountered selling pressure at $16.25 alongside a sizable decline in the broader crypto market.
By CD Analytics, Krisztian Sandor|Edited by Stephen Alpher
Nov 12, 2025, 7:28 p.m.

- LINK fell to just above $15 amid technical overhead supply.
- Trading volume spiked 138% during $16.25 rejection confirming resistance strength.
- The weak price action occurred despite Bitwise’s Chainlink ETF (CLNK) appeared on the DTCC registry, a sign that it might start trading soon.
Chainlink’s LINK token fell 4% on Wednesday after running into strong technical resistance amid broader crypto market weakness.
The pullback came as Bitwise’s proposed Chainlink ETF was spotted on the DTCC registry under the ticker CLNK, signaling operational readiness for a potential launch.
STORY CONTINUES BELOW
The development initially sent LINK higher, testing resistance near $16.25, CoinDesk research’s technical analysis model said. But the move triggered aggressive selling, with 3.36 million tokens traded during the 16:00 UTC hour, 138% above the 24-hour average, sending LINK down to a session low of $15.10, according to CoinDesk data.
While the DTCC listing represents a step forward for the ETF process, it doesn’t guarantee SEC approval. Market participants largely treated the listing as a procedural milestone rather than a bullish catalyst, keeping their focus on chart levels. The $16.15–$16.25 zone proved too strong to break, reinforcing it as a key overhead supply region.
- Support/Resistance: Primary support locked at $15.10 from institutional selling wave, with immediate resistance at $15.40-$15.50 based on recovery channel dynamics
- Volume Analysis: 24-hour activity runs 9.39% above weekly average, with 3.36M share spike during $16.25 breakdown confirming heavy overhead supply at resistance
- Chart Patterns: Ascending channel formation from overnight lows encounters resistance ceiling, with current action suggesting continued range-trading between $15.10-$16.25 boundaries
- Targets & Risk/Reward: Upside targets sit at $15.50 and $16.00 levels, with downside risk toward $15.00 psychological support if recovery momentum stalls.
Disclaimer: Parts of this article were generated with the assistance from AI tools and reviewed by our editorial team to ensure accuracy and adherence to our standards. For more information, see CoinDesk’s full AI Policy.
More For You
Oct 16, 2025

Stablecoin payment volumes have grown to $19.4B year-to-date in 2025. OwlTing aims to capture this market by developing payment infrastructure that processes transactions in seconds for fractions of a cent.
More For You
By CD Analytics, Siamak Masnavi
2 hours ago

Institutional inflows of $336 million fail to offset selling pressure as SOL falls to $153 amid fresh token releases.
What to know:
- SOL dropped 4.9% to $153.49 despite recording $336 million in weekly ETF inflows.
- Alameda Research unlocked another 193,000 SOL tokens valued at approximately $30 million.
- Technical breakdown below $156 support accelerates selling toward $152.80 demand zone.


-
Back to menu
Prices
-
Back to menu
-
Back to menu
Indices -
Back to menu
Research
-
Back to menu
Consensus 2026 -
Back to menu
Sponsored
-
Back to menu
Videos -
Back to menu
-
Back to menu
-
Back to menu
Webinars
Select Language