-
Back to menu
Prices
-
Back to menu
-
Back to menu
Indices -
Back to menu
Research
-
Back to menu
Events -
Back to menu
Sponsored
-
Back to menu
Videos -
Back to menu
-
Back to menu
-
Back to menu
Webinars
Select Language
By CD Analytics, Oliver Knight
Updated Aug 7, 2025, 4:05 p.m. Published Aug 7, 2025, 4:05 p.m.

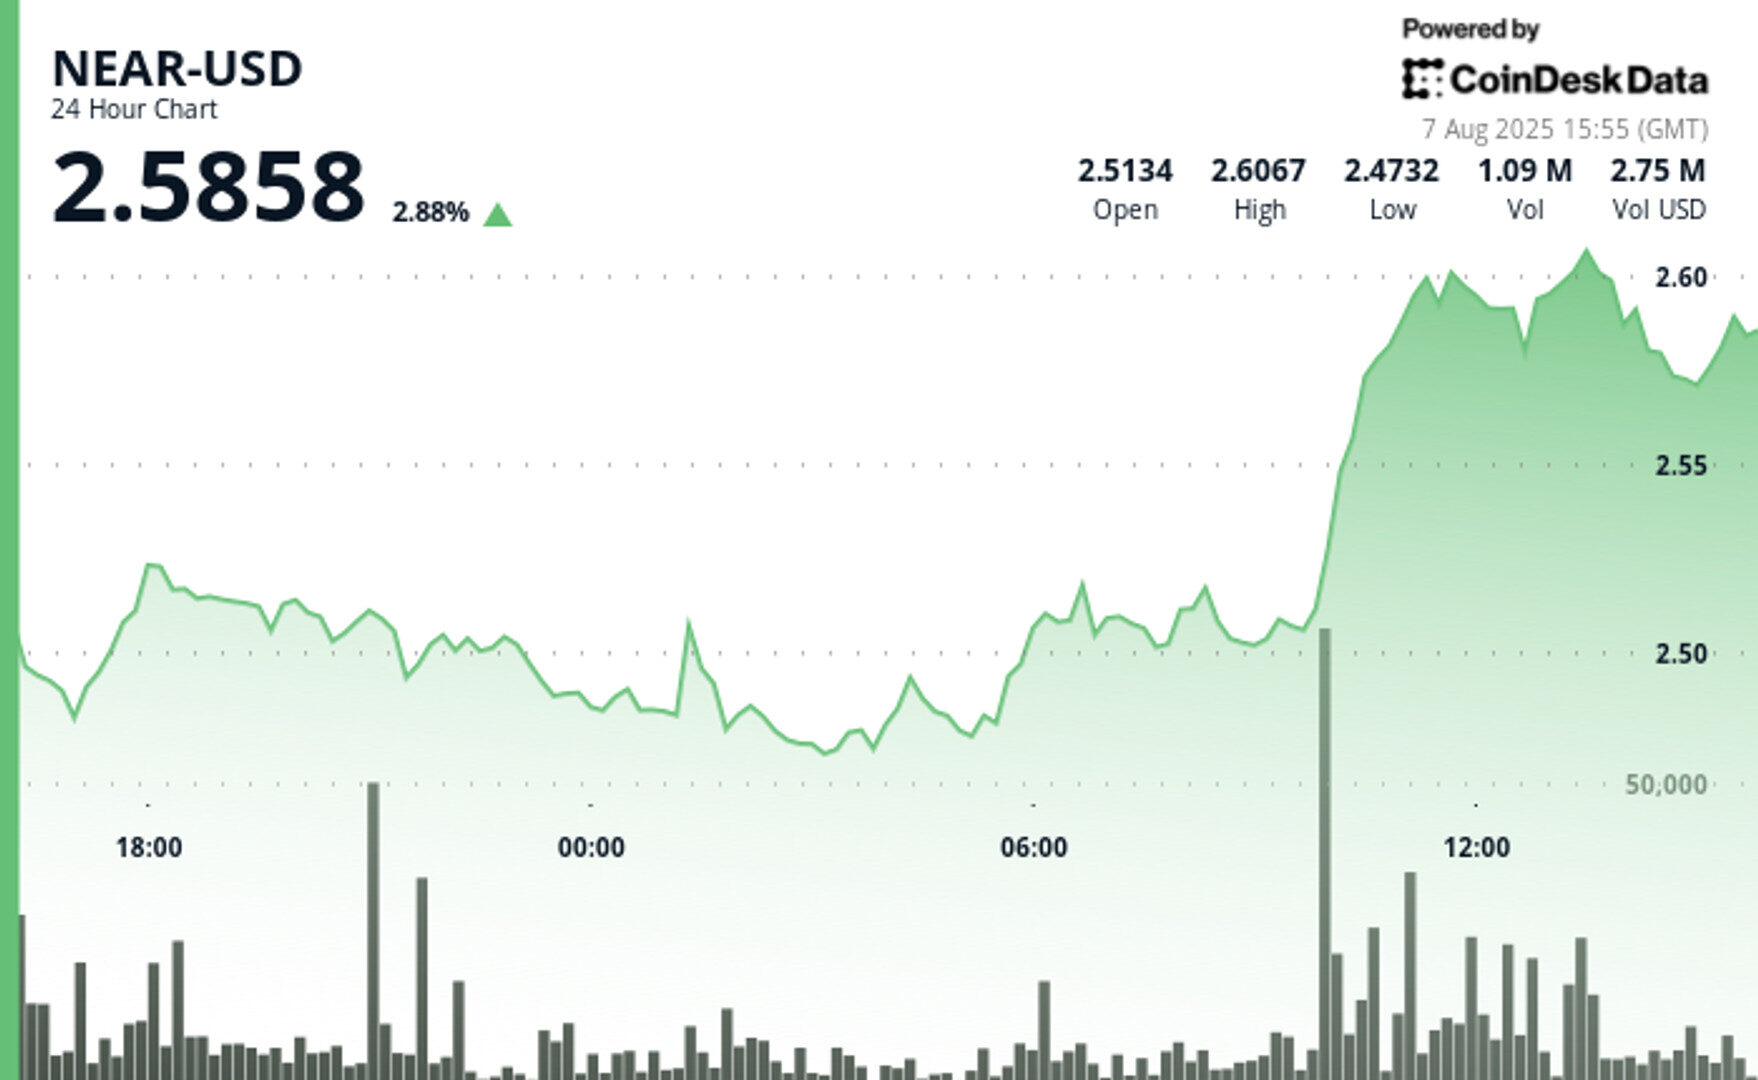
- NEAR Protocol rallied 5% from $2.47 to $2.60 between 6 August 15:00 and 7 August 14:00 UTC, driven by institutional accumulation and strong volume amid global macro uncertainty.
- A final-hour volatility spike from 13:06 to 14:05 UTC erased earlier gains, as NEAR tested $2.61 before selling pressure pushed it back to $2.60, forming fresh support near $2.598.
- Broader economic tensions and shifting monetary policy continue to influence crypto flows, with NEAR’s late-session retracement reflecting profit-taking and potential institutional distribution.
NEAR Protocol climbed 5% from $2.47 to $2.60 in the 24-hour period ending 7 August at 14:00 UTC, exhibiting strong resilience amid broader market turbulence. Institutional accumulation helped fuel a recovery rally after early-session lows, with price action coalescing between $2.48 and $2.52 before a sharp upside break around 10:00 UTC, supported by 3.36 million in trading volume. The asset’s advance, partially influenced by global risk-off sentiment, reflected investors’ pivot to alternative assets during heightened geopolitical and macroeconomic uncertainty.
Late-Session Sell-Off Caps Bullish Momentum

STORY CONTINUES BELOW
Despite its earlier strength, NEAR’s final hour of trading—from 13:06 to 14:05 UTC—witnessed a surge in volatility that erased most intraday gains. After briefly testing resistance at $2.61, a spike in volume between 13:39 and 13:42 coincided with profit-taking behavior. Selling pressure shaped a descending channel, with price retreating to close at $2.60, slightly above fresh support near $2.598. The move signals possible short-term exhaustion, as institutional distribution may be limiting further upside despite earlier accumulation.
Macro Conditions Continue to Shape Market Dynamics
The backdrop of NEAR’s performance remains heavily influenced by shifting macroeconomic forces. As major economies recalibrate monetary policy in response to inflationary effects from ongoing trade disputes, institutional flows into digital assets like NEAR have intensified. The cryptocurrency’s intraday pullback mirrors broader market hesitation, as participants digest global policy shifts and their implications for crypto-market structure and risk appetite.
Technical Indicators Analysis
- NEAR Protocol demonstrated considerable resilience during the preceding 24-hour period from 6 August 15:00 to 7 August 14:00, recovering from early session nadirs of $2.47 to close at $2.60, representing a compelling 5% gain.
- The cryptocurrency exhibited a classic accumulation pattern throughout the initial 18 hours, consolidating between $2.47-$2.52 before surging dramatically at 10:00 on 7 August with exceptional volume of 3.36 million units—approaching threefold the 24-hour average of 1.20 million.
- This breakout established robust support at $2.51 and resistance proximate to $2.61, with the pronounced price expansion suggesting institutional accumulation followed by momentum-driven purchasing that could extend towards $2.65-$2.70 based upon measured move projections.
Disclaimer: Parts of this article were generated with the assistance from AI tools and reviewed by our editorial team to ensure accuracy and adherence to our standards. For more information, see CoinDesk’s full AI Policy.
CoinDesk Analytics is CoinDesk’s AI-powered tool that, with the help of human reporters, generates market data analysis, price movement reports, and financial content focused on cryptocurrency and blockchain markets.
All content produced by CoinDesk Analytics is undergoes human editing by CoinDesk’s editorial team before publication. The tool synthesizes market data and information from CoinDesk Data and other sources to create timely market reports, with all external sources clearly attributed within each article.
CoinDesk Analytics operates under CoinDesk’s AI content guidelines, which prioritize accuracy, transparency, and editorial oversight. Learn more about CoinDesk’s approach to AI-generated content in our AI policy.

Oliver Knight is the co-leader of CoinDesk data tokens and data team. Before joining CoinDesk in 2022 Oliver spent three years as the chief reporter at Coin Rivet. He first started investing in bitcoin in 2013 and spent a period of his career working at a market making firm in the UK. He does not currently have any crypto holdings.

More For You
By CD Analytics, Francisco Rodrigues|Edited by Aoyon Ashraf
1 hour ago

The recent price rally is likely tied to a broader market trend, with growing expectations of a Federal Reserve interest rate cut in September.
What to know:
- PEPE has risen over 5% in the last 24 hours, driven by a high-volume breakout that helped the token surge above a recent resistance level.
- Despite a 73% drop in trading volume across PEPE derivatives contracts since mid-July, the 100 largest Ethereum addresses have increased their holdings by 2.36% over the past 30 days.
- The recent price rally is likely tied to a broader market trend, with growing expectations of a Federal Reserve interest rate cut in September.


