BTC
$108,324.58
–
0.36%
ETH
$2,537.10
–
0.44%
USDT
$1.0000
–
0.01%
XRP
$2.3445
+
3.02%
BNB
$658.79
–
0.64%
SOL
$151.28
–
1.11%
USDC
$0.9999
+
0.00%
TRX
$0.2869
+
0.81%
DOGE
$0.1687
–
1.20%
ADA
$0.5862
+
0.02%
HYPE
$39.55
+
0.22%
SUI
$2.8898
–
1.09%
BCH
$493.08
–
0.58%
WBT
$44.91
–
0.05%
LINK
$13.54
+
0.58%
LEO
$8.9690
–
0.46%
XLM
$0.2544
+
3.67%
AVAX
$18.04
–
1.25%
TON
$2.7805
–
4.26%
SHIB
$0.0₄1160
–
1.83%
By Oliver Knight, CD Analytics
Updated Jul 7, 2025, 4:06 p.m. Published Jul 7, 2025, 4:06 p.m.

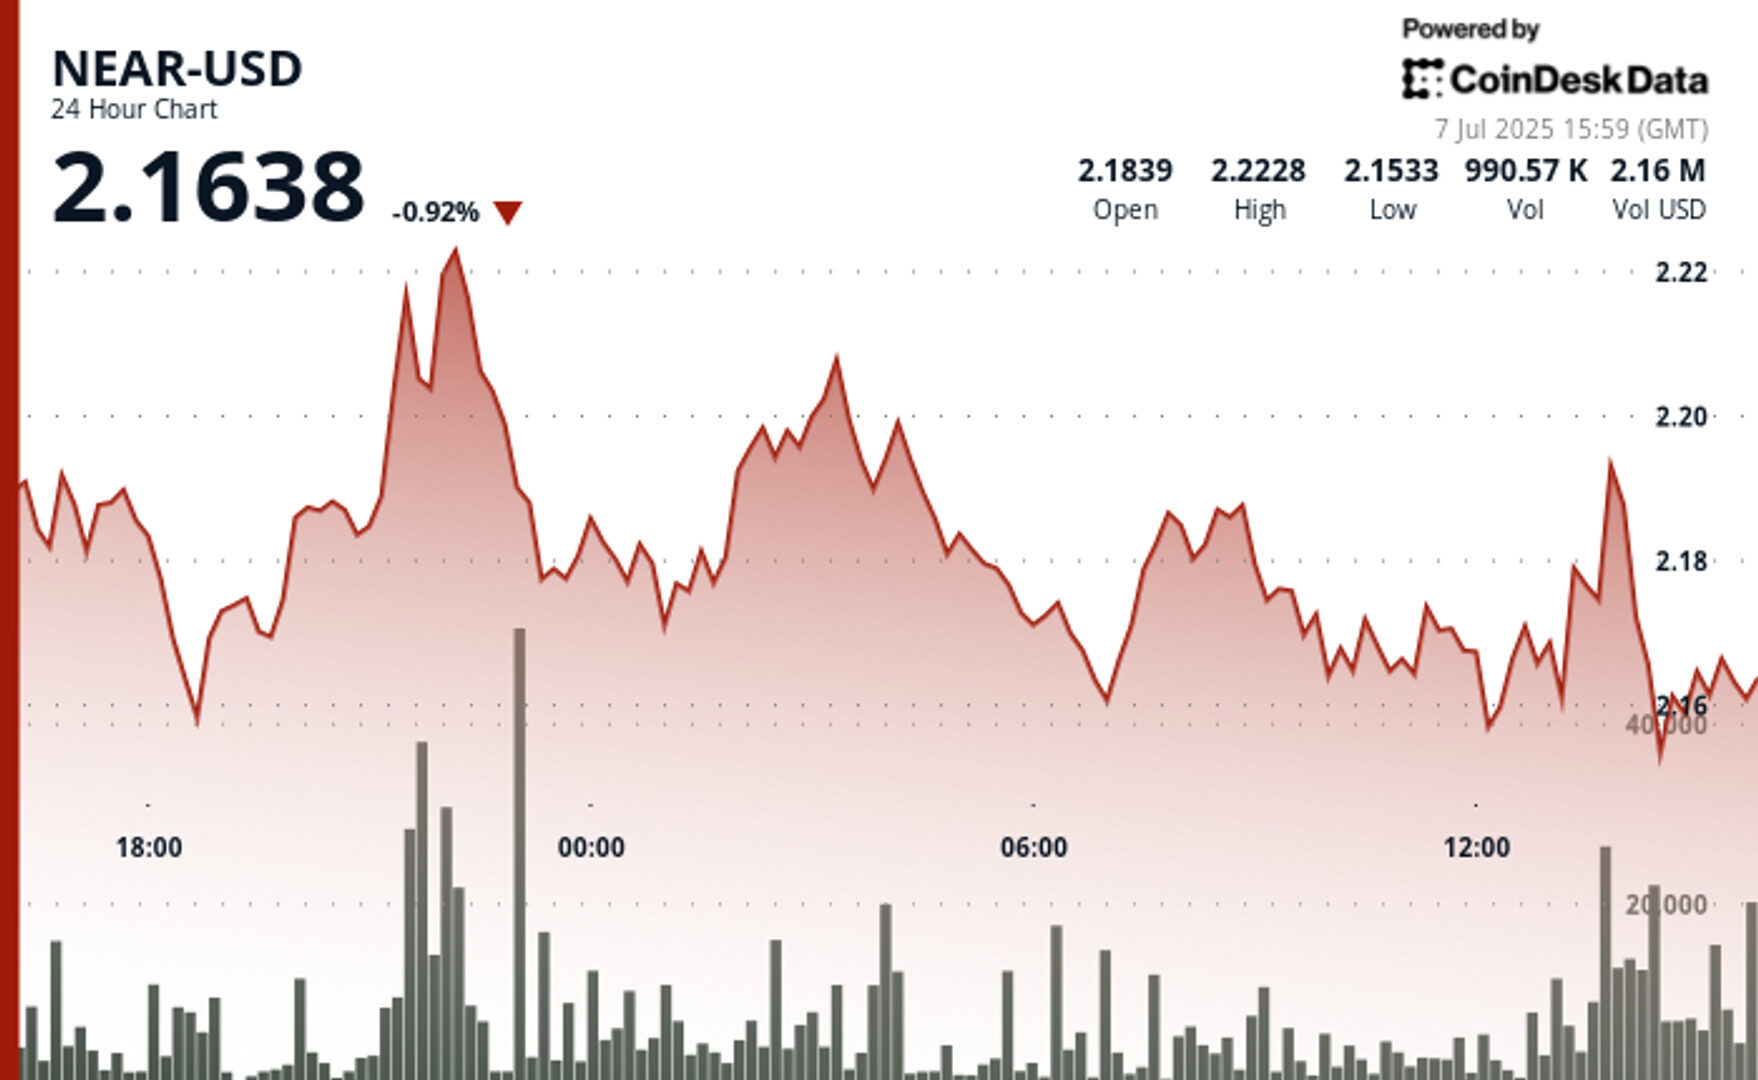
- NEAR Protocol surged past the $2.19 resistance level on exceptional trading volume, with a 1.97M spike compared to the 24-hour average of 1.22M.
- Bitcoin’s price movement above $109K is pulling altcoins higher, with NEAR’s cup and handle pattern suggesting further upside potential.
The cryptocurrency market is showing signs of renewed strength as NEAR Protocol broke through a key resistance level during the final trading hour of July 7. The decisive move came on exceptional volume that was 61% higher than the daily average, confirming the validity of the breakout from an ascending triangle pattern that had been forming throughout the day.
Trading data shows NEAR-USD established strong support in the $2.16-$2.17 range with multiple bounces before finally overcoming resistance at $2.19-$2.20. The breakthrough was particularly notable during the 60-minute period ending at 14:04, when NEAR surged 1.13% from $2.17 to $2.19, forming what analysts describe as a textbook cup and handle pattern.

STORY CONTINUES BELOW
This technical development comes as the broader crypto market experiences significant momentum, with Bitcoin crossing $109K and approaching its all-time high of $111,970.
The total cryptocurrency market capitalization has expanded to $3.36 trillion on a 40% surge in trading volume, creating favorable conditions for altcoins like NEAR to capitalize on improved market sentiment. Despite NEAR’s positive price action, the asset remains significantly below its all-time high of $20.42 reached in January 2022. Current technical indicators present a mixed picture, with 14 green days out of the last 30, but an RSI of 31.09 suggesting oversold conditions that could support further recovery.
Technical analysis
- NEAR-USD exhibited notable volatility during the 24-hour period from 6 July 15:00 to 7 July 14:00, with a price range of $2.16 to $2.22, representing a 3.15% swing.
- The asset established key support at $2.16-$2.17 with multiple bounces, while resistance at $2.19-$2.20 was eventually overcome during the final hour on exceptional volume (1.97M vs 24-hour average of 1.22M).
- The decisive breakout above the $2.19 level, coupled with the formation of a bullish ascending triangle pattern throughout the period, suggests potential for continued upward momentum with the next resistance target at $2.22.
- During the 60-minute period from 7 July 13:05 to 14:04, NEAR-USD exhibited a strong bullish trend, surging from $2.17 to $2.19, representing a 1.13% gain.
- The asset broke through key resistance at $2.18 with exceptional volume spikes at 13:57-13:58 (143,856 units), forming a cup and handle pattern that culminated in a decisive breakout to $2.19.
- Support established at $2.16 during the mid-period pullback (13:17-13:20) held firmly, with buyers stepping in aggressively to fuel the subsequent rally that peaked at $2.19 before minor profit-taking occurred in the final minutes.
CD20 Whipsaws 1.17% Before Finding Support
The CD20 index experienced significant volatility over the last 24 hours from 6 July 15:00 to 7 July 14:00, with a notable 1.17% price range ($21.06) between the high of $1,793.57 and low of $1,772.50.
After reaching a peak during the early hours of 7 July, the market entered a consolidation phase with a sharp 1.17% decline to $1,772.50 at 13:00 before recovering to $1,780.94 by the end of the period, suggesting potential stabilization following the earlier volatility.
Disclaimer: Parts of this article were generated with the assistance from AI tools and reviewed by our editorial team to ensure accuracy and adherence to our standards. For more information, see CoinDesk’s full AI Policy.
Oliver Knight is the co-leader of CoinDesk data tokens and data team. Before joining CoinDesk in 2022 Oliver spent three years as the chief reporter at Coin Rivet. He first started investing in bitcoin in 2013 and spent a period of his career working at a market making firm in the UK. He does not currently have any crypto holdings.

CoinDesk Analytics is CoinDesk’s AI-powered tool that, with the help of human reporters, generates market data analysis, price movement reports, and financial content focused on cryptocurrency and blockchain markets.
All content produced by CoinDesk Analytics is undergoes human editing by CoinDesk’s editorial team before publication. The tool synthesizes market data and information from CoinDesk Data and other sources to create timely market reports, with all external sources clearly attributed within each article.
CoinDesk Analytics operates under CoinDesk’s AI content guidelines, which prioritize accuracy, transparency, and editorial oversight. Learn more about CoinDesk’s approach to AI-generated content in our AI policy.


