BTC
$108,847.34
–
0.31%
ETH
$2,551.48
–
1.46%
USDT
$1.0002
–
0.00%
XRP
$2.2402
–
1.79%
BNB
$659.94
–
0.14%
SOL
$150.56
–
1.66%
USDC
$0.9998
–
0.00%
TRX
$0.2861
+
0.70%
DOGE
$0.1670
–
2.84%
ADA
$0.5825
–
2.79%
HYPE
$38.76
–
3.78%
SUI
$2.9268
–
2.78%
WBT
$44.58
+
2.20%
BCH
$481.93
–
3.59%
LINK
$13.38
–
3.20%
LEO
$9.0361
+
0.21%
AVAX
$18.15
–
2.91%
XLM
$0.2403
–
1.96%
TON
$2.8239
–
1.84%
SHIB
$0.0₄1160
–
2.00%
By CD Analytics, Francisco Rodrigues|Edited by Sheldon Reback
Jul 4, 2025, 11:36 a.m.

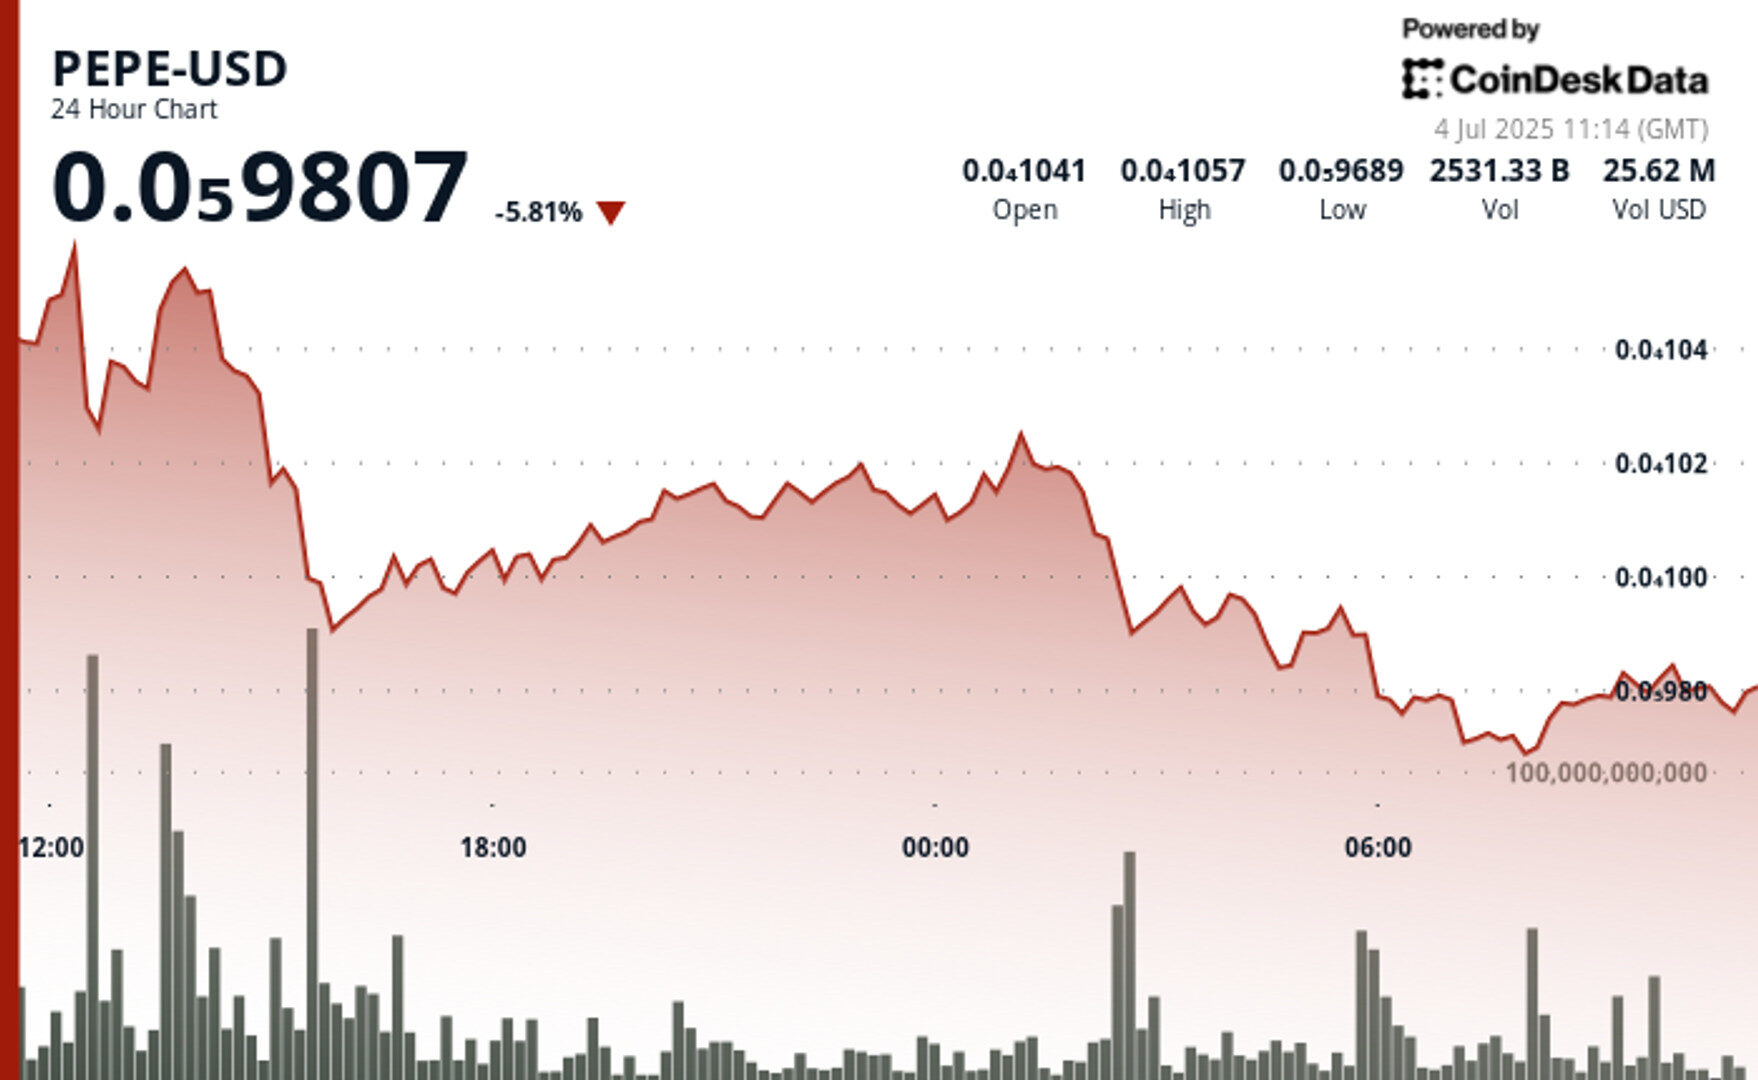
- PEPE slid nearly 6% in 24 hours, experiencing increased market volatility as Trump’s reciprocal tariffs deadline approaches.
- Despite the price drop, large addresses, or “whale” wallets, have grown their PEPE holdings by over 5% in the past month.
- Technical analysis shows PEPE struggling to hold gains above $0.0000106, with support around $0.00000965, and a descending channel pattern indicating persistent selling pressure, but brief rebounds and surges in buying interest suggest the memecoin is not out of the fight yet.
The frog-themed memecoin PEPE (PEP) slid nearly 6% over the 24 hours, as Trump’s reciprocal tariffs deadline sent ripples through the cryptocurrency market and exposed the token’s volatility.
PEPE’s price swung across a 16.5% trading range, underscoring how fast sentiment can flip in a market increasingly sensitive to geopolitical and macroeconomic signals when trading volumes drop.

STORY CONTINUES BELOW
Behind the price drop, however, large addresses appear unfazed. Data from blockchain analytics firm Nansen shows whale wallets have increased their PEPE holdings by over 5% in the past month, scooping up tokens now valued at around $3 billion, over 70% of PEPE’s supply.
Meanwhile, the total supply of PEPE on exchanges slipped to a two-year low of roughly 247.2 trillion tokens, a near 3% decrease since the start of July, according to the same source.
PEPE has struggled to hold gains after testing resistance near $0.0000106, encountering firm selling pressure that pushed the price lower.
The coin found support around $0.00000965, keeping it from sliding further, though the overall trading range reflects persistent volatility, according to CoinDesk Research’s technical analysis data model.
Charts show a descending channel shaping the recent price action, with sellers stepping in on upward moves. Trading volumes reveal a pattern of distribution during price spikes, hinting that traders are offloading positions rather than building fresh longs.
However, brief rebounds and surges in buying interest suggest the memecoin isn’t out of the fight. A burst of volume helped lift prices modestly from recent lows, signaling that some traders still see room for a bounce if broader market sentiment improves.
CoinDesk Analytics is CoinDesk’s AI-powered tool that, with the help of human reporters, generates market data analysis, price movement reports, and financial content focused on cryptocurrency and blockchain markets.
All content produced by CoinDesk Analytics is undergoes human editing by CoinDesk’s editorial team before publication. The tool synthesizes market data and information from CoinDesk Data and other sources to create timely market reports, with all external sources clearly attributed within each article.
CoinDesk Analytics operates under CoinDesk’s AI content guidelines, which prioritize accuracy, transparency, and editorial oversight. Learn more about CoinDesk’s approach to AI-generated content in our AI policy.

Francisco is a reporter for CoinDesk with a passion for cryptocurrencies and personal finance. Before joining CoinDesk he worked at major financial and crypto publications. He owns bitcoin, ether, solana, and PAXG above CoinDesk’s $1,000 disclosure threshold.


