-
Back to menu
Prices
-
Back to menu
-
Back to menu
Indices -
Back to menu
Research
-
Back to menu
Events -
Back to menu
Sponsored
-
Back to menu
Videos -
Back to menu
-
Back to menu
-
Back to menu
Webinars
Select Language
By CD Analytics, Will Canny|Edited by Aoyon Ashraf
Aug 1, 2025, 4:48 p.m.

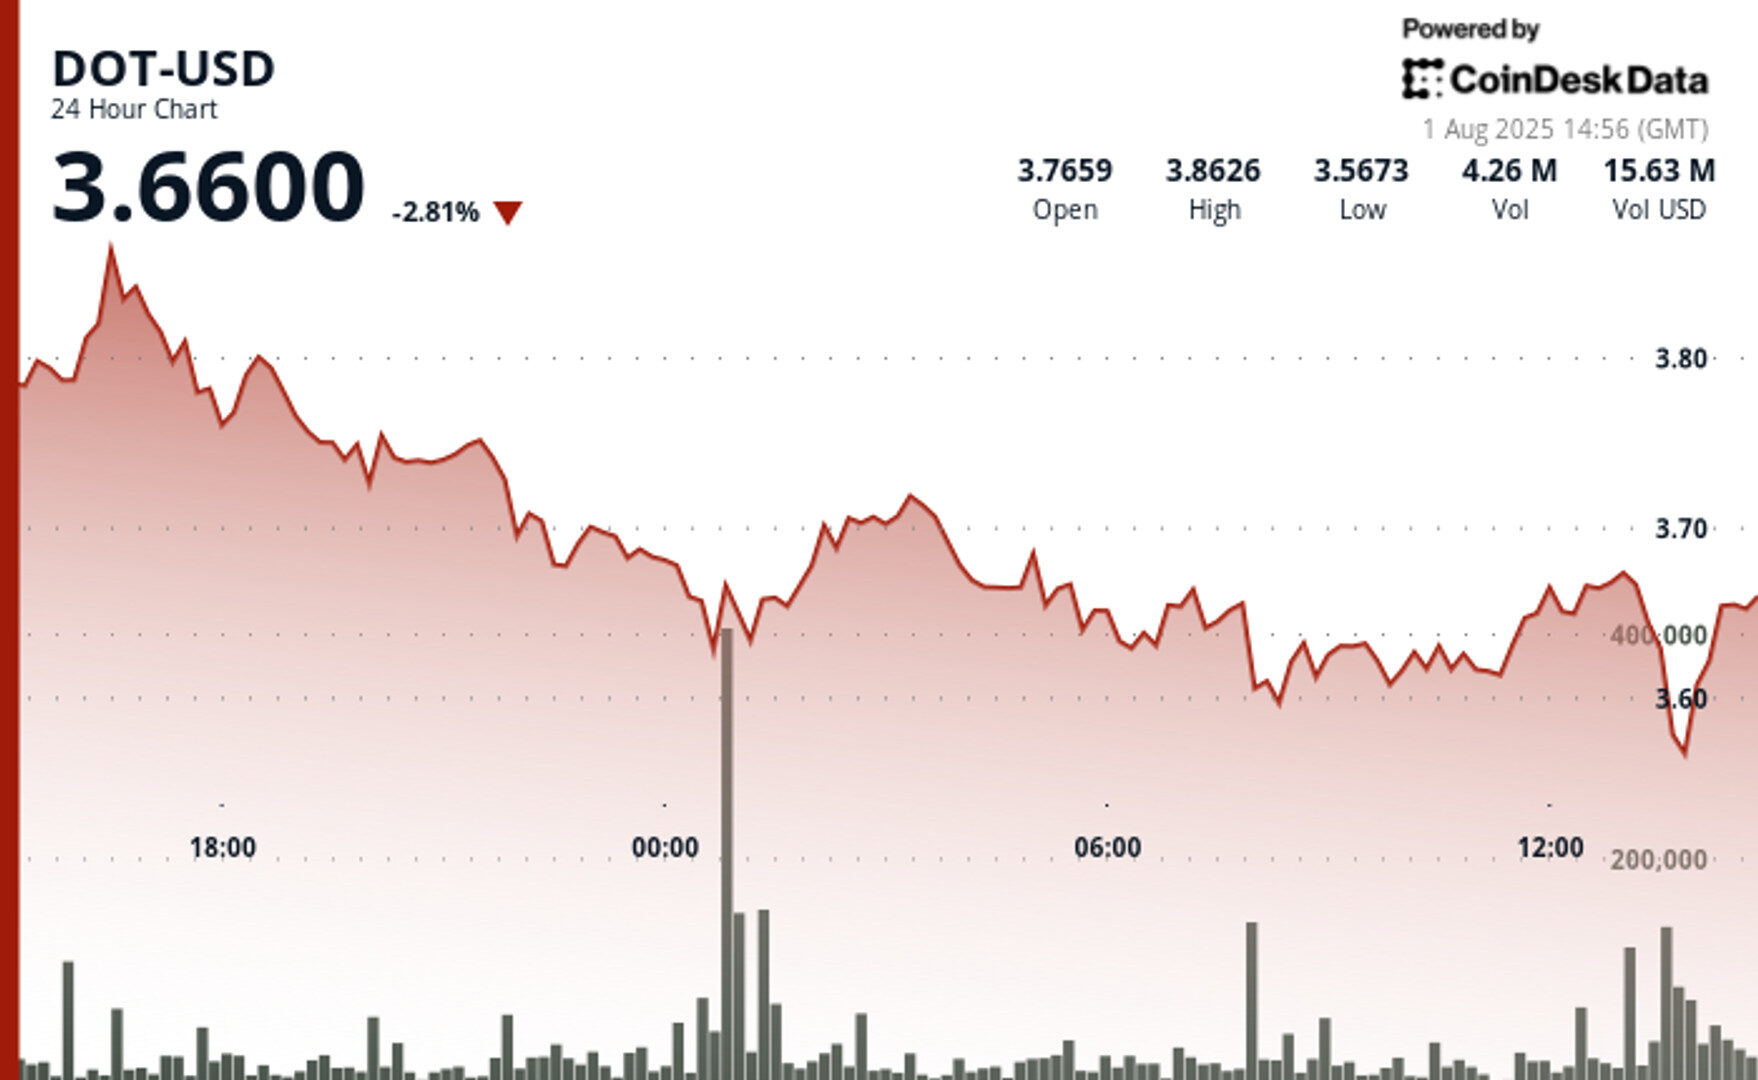
- DOT fell over 5% amidst a broad selloff in crypto markets.
- The token has support in the $3.55-$3.58 range, with resistance at $3.68.
Polkadot’s DOT encountered substantial bearish momentum over the last 24 hours, retreating from $3.76 to $3.56, or more than 5%, according to CoinDesk Research’s technical analysis model.
The model showed that DOT initially demonstrated resilience, achieving an intraday high of $3.87 on July 31, yet subsequently confronted relentless selling pressure accompanied by pronounced volume surges during pivotal breakdown junctures on August 1.

STORY CONTINUES BELOW
The token now has support in the $3.55-$3.58 range, with resistance at the $3.68 level, according to the model.
In recent trading, DOT was 5.3% lower over 24 hours, trading around $3.64.
The decline in Polkadot came as the wider crypto market also fell, with the broader market gauge, the CoinDesk 20 index, recently down 3.7%
Technical Analysis:
- Price retreated from $3.76 to $3.56, representing a 5% decline over 24 hours.
- Intraday peak reached at $3.87 at 16:00 UTC on July 31 before selling pressure intensified.
- Volume exceeded 24-hour average of 3 million during key breakdown periods.
- Substantial resistance confirmed at $3.68 level.
- Fresh support established around $3.55-$3.58 range.
- Critical support breach occurred at $3.60 during final hour decline.
- New resistance formed around $3.67 level.
- Volume spikes exceeded 200,000 units during 13:45-13:46 UTC and 13:54 UTC periods.
- Negligible trading activity recorded in final three minutes, suggesting market exhaustion.
Disclaimer: Parts of this article were generated with the assistance from AI tools and reviewed by our editorial team to ensure accuracy and adherence to our standards. For more information, see CoinDesk’s full AI Policy.
CoinDesk Analytics is CoinDesk’s AI-powered tool that, with the help of human reporters, generates market data analysis, price movement reports, and financial content focused on cryptocurrency and blockchain markets.
All content produced by CoinDesk Analytics is undergoes human editing by CoinDesk’s editorial team before publication. The tool synthesizes market data and information from CoinDesk Data and other sources to create timely market reports, with all external sources clearly attributed within each article.
CoinDesk Analytics operates under CoinDesk’s AI content guidelines, which prioritize accuracy, transparency, and editorial oversight. Learn more about CoinDesk’s approach to AI-generated content in our AI policy.

Will Canny is an experienced market reporter with a demonstrated history of working in the financial services industry. He’s now covering the crypto beat as a finance reporter at CoinDesk. He owns more than $1,000 of SOL.

More For You
By Jamie Crawley, CD Analytics|Edited by Stephen Alpher
2 hours ago

Meme coin loses ground amid broad risk-off sentiment and $0.000025 support test
What to know:
- BONK fell 5% from $0.000028 to $0.0000266 during the 24 hours.
- BONK saw a slight recovery during mid-morning in the U.S., lifting to $0.0000275 to repair some of the damage from earlier.
- Strong resistance held at $0.000029 while $0.000026 support shows signs of weakening.


