XLM Climbs 3.5% to $0.25 as Technical Recovery Gains Momentum
-
News
-
Video
-
Consensus 2026
-
Data & Indices
Network fundamentals improved alongside price action as token demonstrated resilience following recent consolidation period.
By CD Analytics, Oliver Knight
Updated Nov 24, 2025, 6:15 p.m. Published Nov 24, 2025, 6:15 p.m.

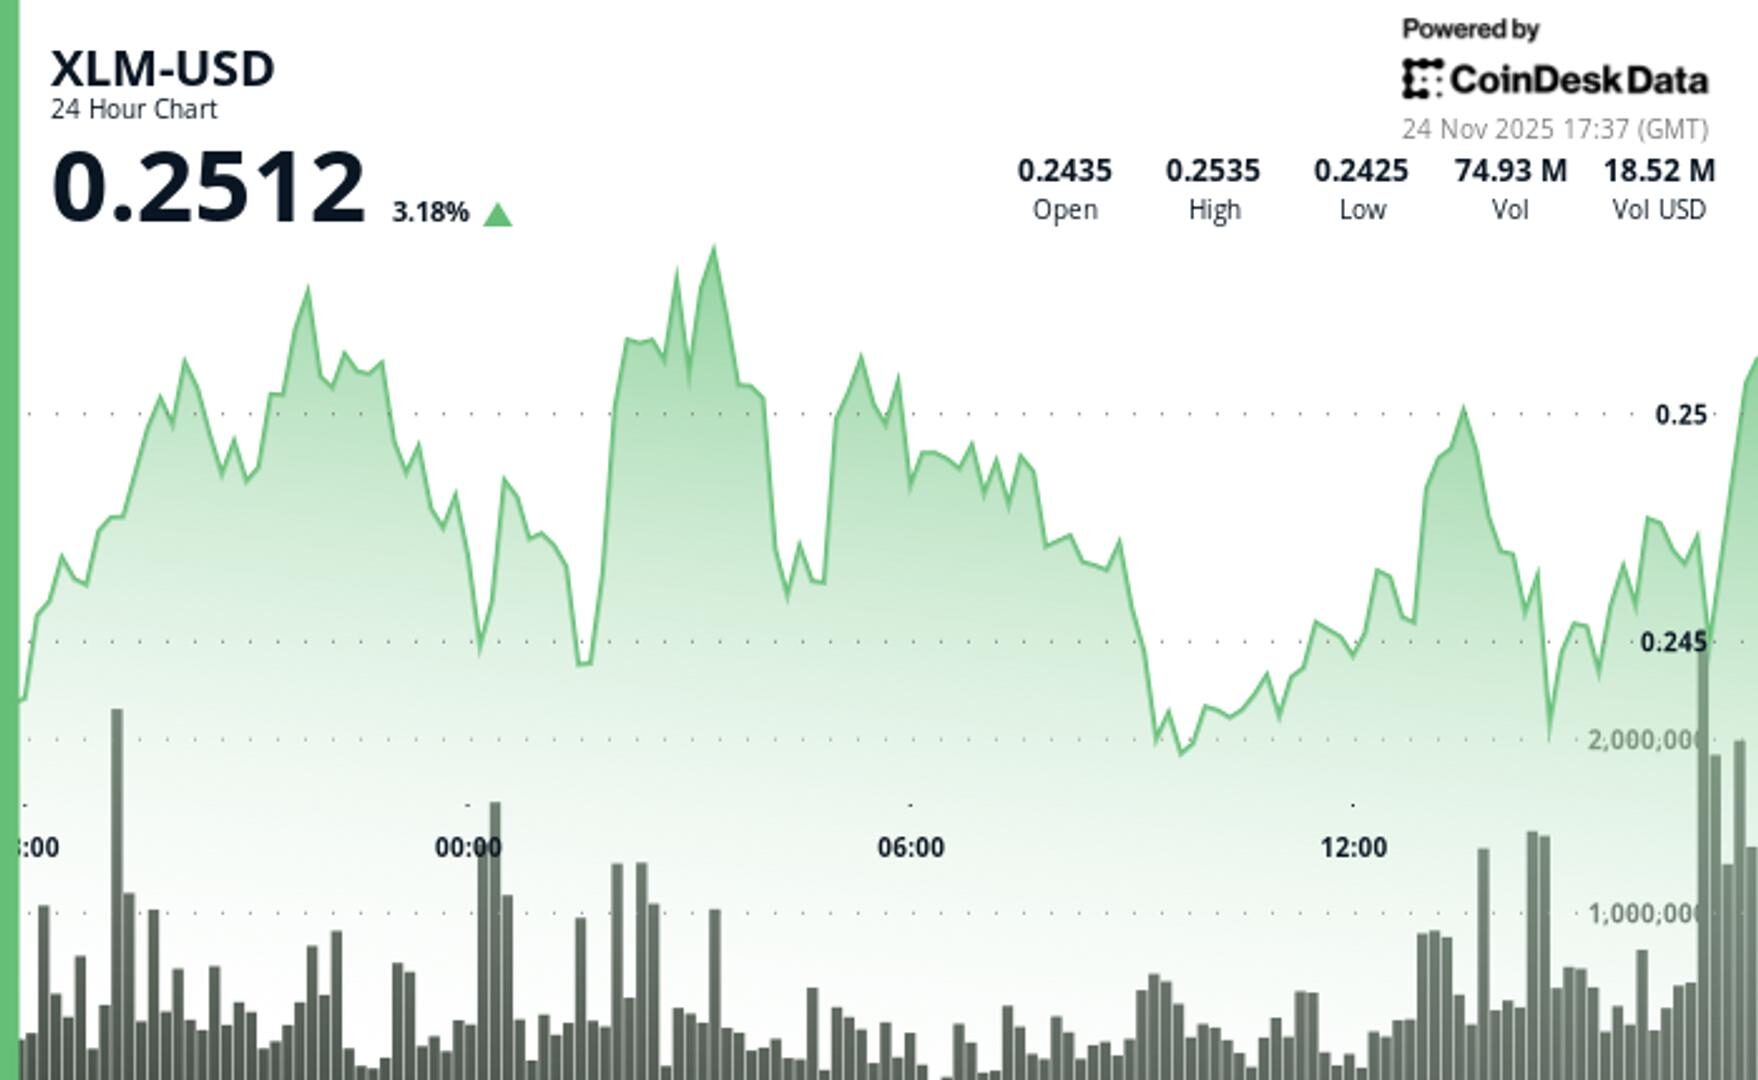
- XLM advanced from $0.2436 to $0.2508 with elevated trading volume.
- Volume surged 23% above weekly average, confirming genuine buying interest.
- Late-session selling pressure created new support test near $0.2449.
Stellar’s XLM notched solid gains Tuesday, rising 3.53% to $0.2508 and outperforming the broader crypto market by more than a percentage point. Trading activity picked up meaningfully, with volumes running 23% above weekly norms — a sign traders were positioning for a potential breakout even in the absence of major fundamental catalysts.
The rally pushed XLM directly into resistance at $0.2540, creating a key technical battleground as intraday volatility reached nearly 5%. While price action briefly tested both sides of the market, overnight trading delivered the session’s most notable development: a 70.4 million surge in traded tokens, roughly 94% above the 24-hour average, helping reinforce support near $0.2443.
STORY CONTINUES BELOW
Momentum, however, began to shift late in the session. Heavy sell orders hit during the final minutes of trading, driving XLM from $0.2477 to $0.2449 on a 2.8 million-token spike at 16:58. The abrupt reversal pointed to profit-taking pressure and signaled emerging downside risks.
With fundamentals quiet, traders are now focused on whether XLM can reclaim the $0.2540 resistance zone or if late-session weakness sets the stage for a retest of support around $0.2420. Elevated volume alongside shifting institutional flow patterns suggests volatility could remain elevated in the near term.

- Support/Resistance: Primary support holds at $0.2422 with resistance forming near $0.2540; new support test at $0.2449 following late selling.
- Volume Analysis: 23% surge above weekly average confirmed buying interest; final-hour institutional flow suggested profit-taking pressure.
- Chart Patterns: Range-bound consolidation with $0.0124 trading range; late-session reversal pattern created downside momentum.
- Targets & Risk: Further decline toward $0.2420 likely if selling persists; upside resistance remains at $0.2540 level.
Disclaimer: Parts of this article were generated with the assistance from AI tools and reviewed by our editorial team to ensure accuracy and adherence to our standards. For more information, see CoinDesk’s full AI Policy.
Más para ti
14 nov 2025

Lo que debes saber:
- As of October 2025, GoPlus has generated $4.7M in total revenue across its product lines. The GoPlus App is the primary revenue driver, contributing $2.5M (approx. 53%), followed by the SafeToken Protocol at $1.7M.
- GoPlus Intelligence’s Token Security API averaged 717 million monthly calls year-to-date in 2025 , with a peak of nearly 1 billion calls in February 2025. Total blockchain-level requests, including transaction simulations, averaged an additional 350 million per month.
- Since its January 2025 launch , the $GPS token has registered over $5B in total spot volume and $10B in derivatives volume in 2025. Monthly spot volume peaked in March 2025 at over $1.1B , while derivatives volume peaked the same month at over $4B.
Más para ti
Por CD Analytics, Oliver Knight
hace 42 minutos

Volume surge validates advance despite token’s underperformance versus broader crypto market rally.
Lo que debes saber:
- HBAR climbed to $0.144 on 59% above-average volume during 24-hour session.
- Token lagged CD5 crypto index by 1.64% amid selective institutional rotation.
- Axelar integration connects Hedera to 60+ blockchains, expanding DeFi access.


-
Back to menu
-
Back to menu
Prices
-
Back to menu
-
Back to menu
Indices -
Back to menu
Research
-
Back to menu
Consensus 2026 -
Back to menu
Sponsored
-
Back to menu
-
Back to menu
Podcasts -
Back to menu
-
Back to menu
Webinars
Select Language