Stellar Slips as Key Support Breaks, Signaling Mounting Bearish Momentum
-
News
-
Video
-
Consensus 2026
-
Data & Indices
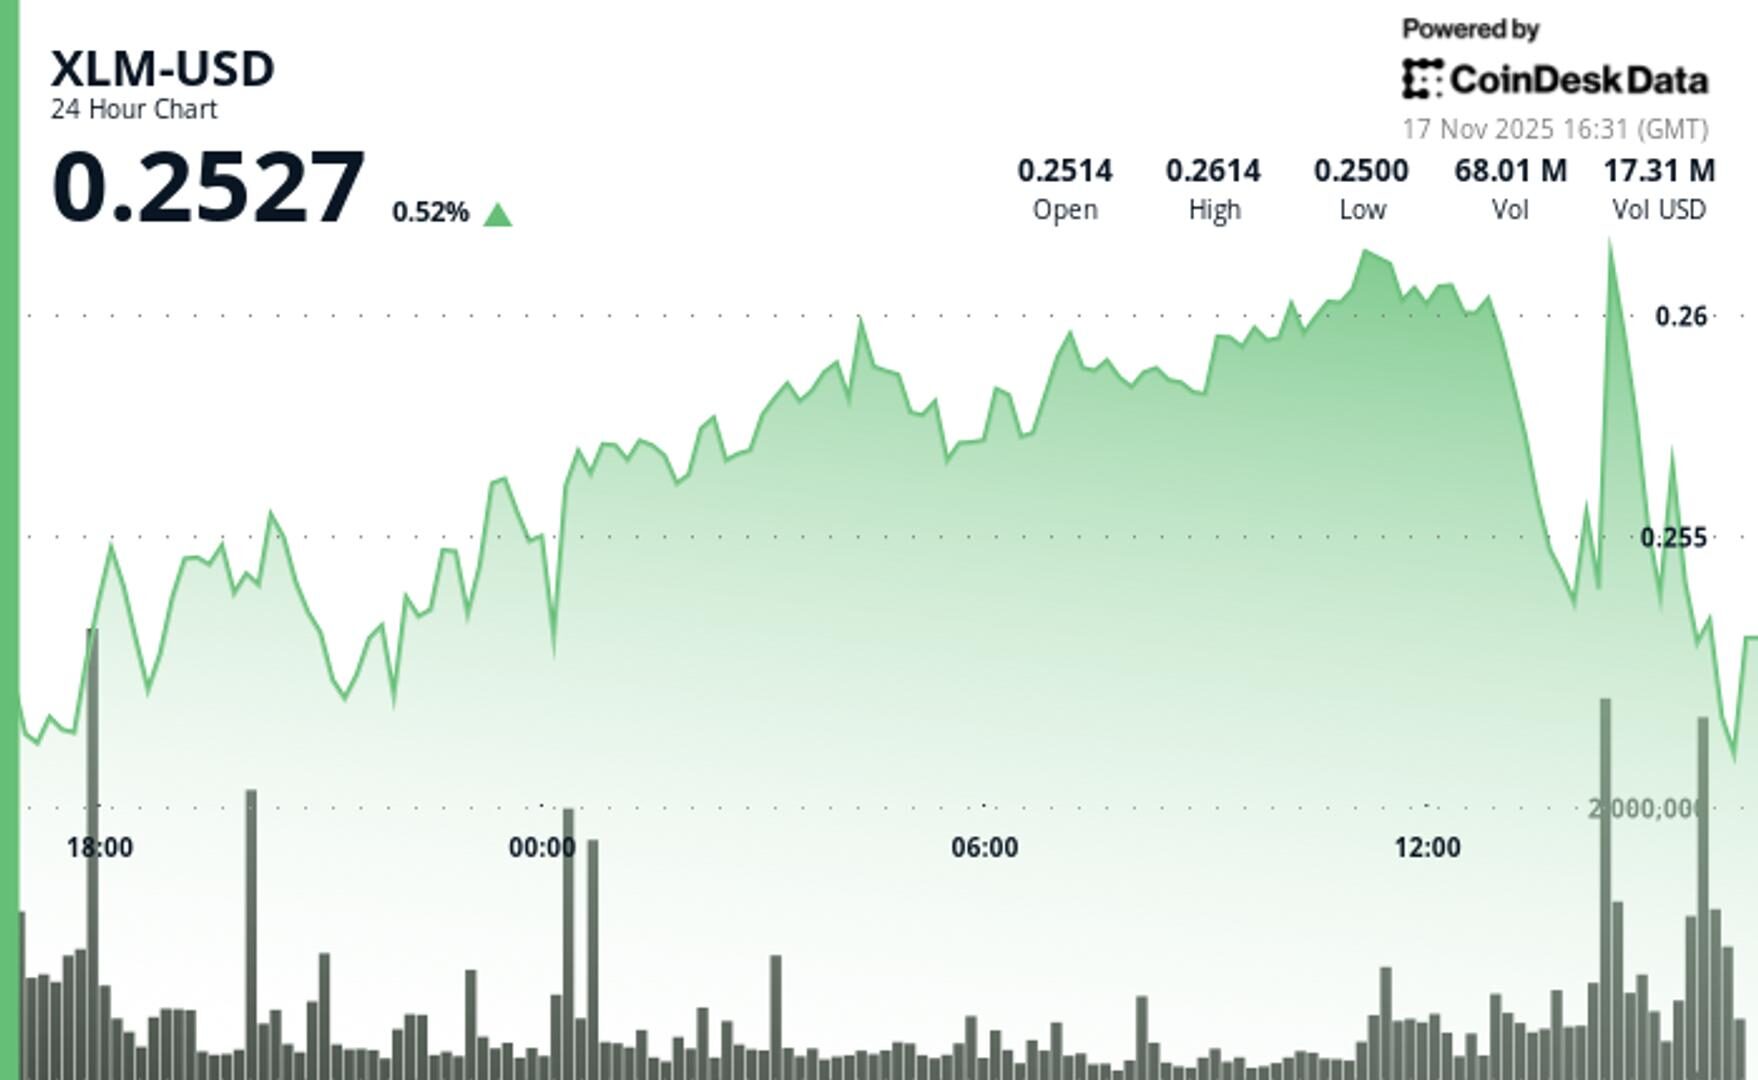
A sharp volume-driven breakdown below XLM’s ascending trendline and critical support at $0.2527 has shifted the market structure bearish, setting sights on the $0.2500 zone
By CD Analytics, Oliver Knight
Updated Nov 17, 2025, 4:38 p.m. Published Nov 17, 2025, 4:38 p.m.

- XLM dropped from $0.2580 to $0.2548 over 24 hours, breaking ascending trendline support.
- Volume jumped 78% above average at 30.4 million during critical breakdown at $0.2521 level.
- Price tested $0.2500 psychological support as selling pressure mounted.
Stellar’s price weakened on Nov. 17, slipping 1.2% over 24 hours as volatility and volume surged. XLM fell from $0.2580 to $0.2548 while carving out a choppy consolidation range of 3.3%.
The session’s tone shifted notably after a sharp rejection from resistance near $0.2607, confirming a breakdown from the prior uptrend and signaling deteriorating momentum.
STORY CONTINUES BELOW
The most decisive move came around 13:00 UTC, when a 30.4 million XLM volume spike—well above the daily average—drove XLM below its ascending trendline from $0.2521.
Subsequent 60-minute action showed accelerating bearish pressure, with heavy selling pushing the token from $0.2586 down to $0.2535. The breach of key support at $0.2527 and new session lows around $0.2531 have opened the door to a possible retest of the psychological $0.2500 zone.

Support/Resistance: Primary support tests at $0.2527 before breakdown, with $0.2500 psychological level as next target; resistance establishes at $0.2607 with session high rejection at $0.2617.
Volume Analysis: Massive spike to 30.4M during breakdown represents 78% increase above 24-hour average, confirming institutional selling pressure at critical levels.
Chart Patterns: Ascending trendline from $0.2521 breaks decisively, volatile consolidation pattern with 3.3% range suggests continued uncertainty in near-term direction.
Targets & Risk/Reward: Immediate downside target at $0.2500 represents 1.9% decline from breakdown level, while recovery above $0.2580 needs to occur to negate bearish structure.
Disclaimer: Parts of this article were generated with the assistance from AI tools and reviewed by our editorial team to ensure accuracy and adherence to our standards. For more information, see CoinDesk’s full AI Policy.
More For You
Nov 14, 2025

What to know:
- As of October 2025, GoPlus has generated $4.7M in total revenue across its product lines. The GoPlus App is the primary revenue driver, contributing $2.5M (approx. 53%), followed by the SafeToken Protocol at $1.7M.
- GoPlus Intelligence’s Token Security API averaged 717 million monthly calls year-to-date in 2025 , with a peak of nearly 1 billion calls in February 2025. Total blockchain-level requests, including transaction simulations, averaged an additional 350 million per month.
- Since its January 2025 launch , the $GPS token has registered over $5B in total spot volume and $10B in derivatives volume in 2025. Monthly spot volume peaked in March 2025 at over $1.1B , while derivatives volume peaked the same month at over $4B.
More For You
By CD Analytics, Oliver Knight
9 minutes ago

Technical breakdown accelerated as selling pressure peaked during final hours of trading session.
What to know:
- HBAR fell from $0.1518 to $0.1480, breaching critical support at $0.1480.
- Volume surged 180% above session averages during steepest decline phase.
- Analysis coincided with reports of WBTC integration enhancing DeFi functionality.


-
Back to menu
Prices
-
Back to menu
-
Back to menu
Indices -
Back to menu
Research
-
Back to menu
Consensus 2026 -
Back to menu
Sponsored
-
Back to menu
Videos -
Back to menu
-
Back to menu
-
Back to menu
Webinars
Select Language