-
Back to menu
Prices
-
Back to menu
-
Back to menu
Indices -
Back to menu
Research
-
Back to menu
Events -
Back to menu
Sponsored
-
Back to menu
Videos -
Back to menu
-
Back to menu
-
Back to menu
Webinars
Select Language
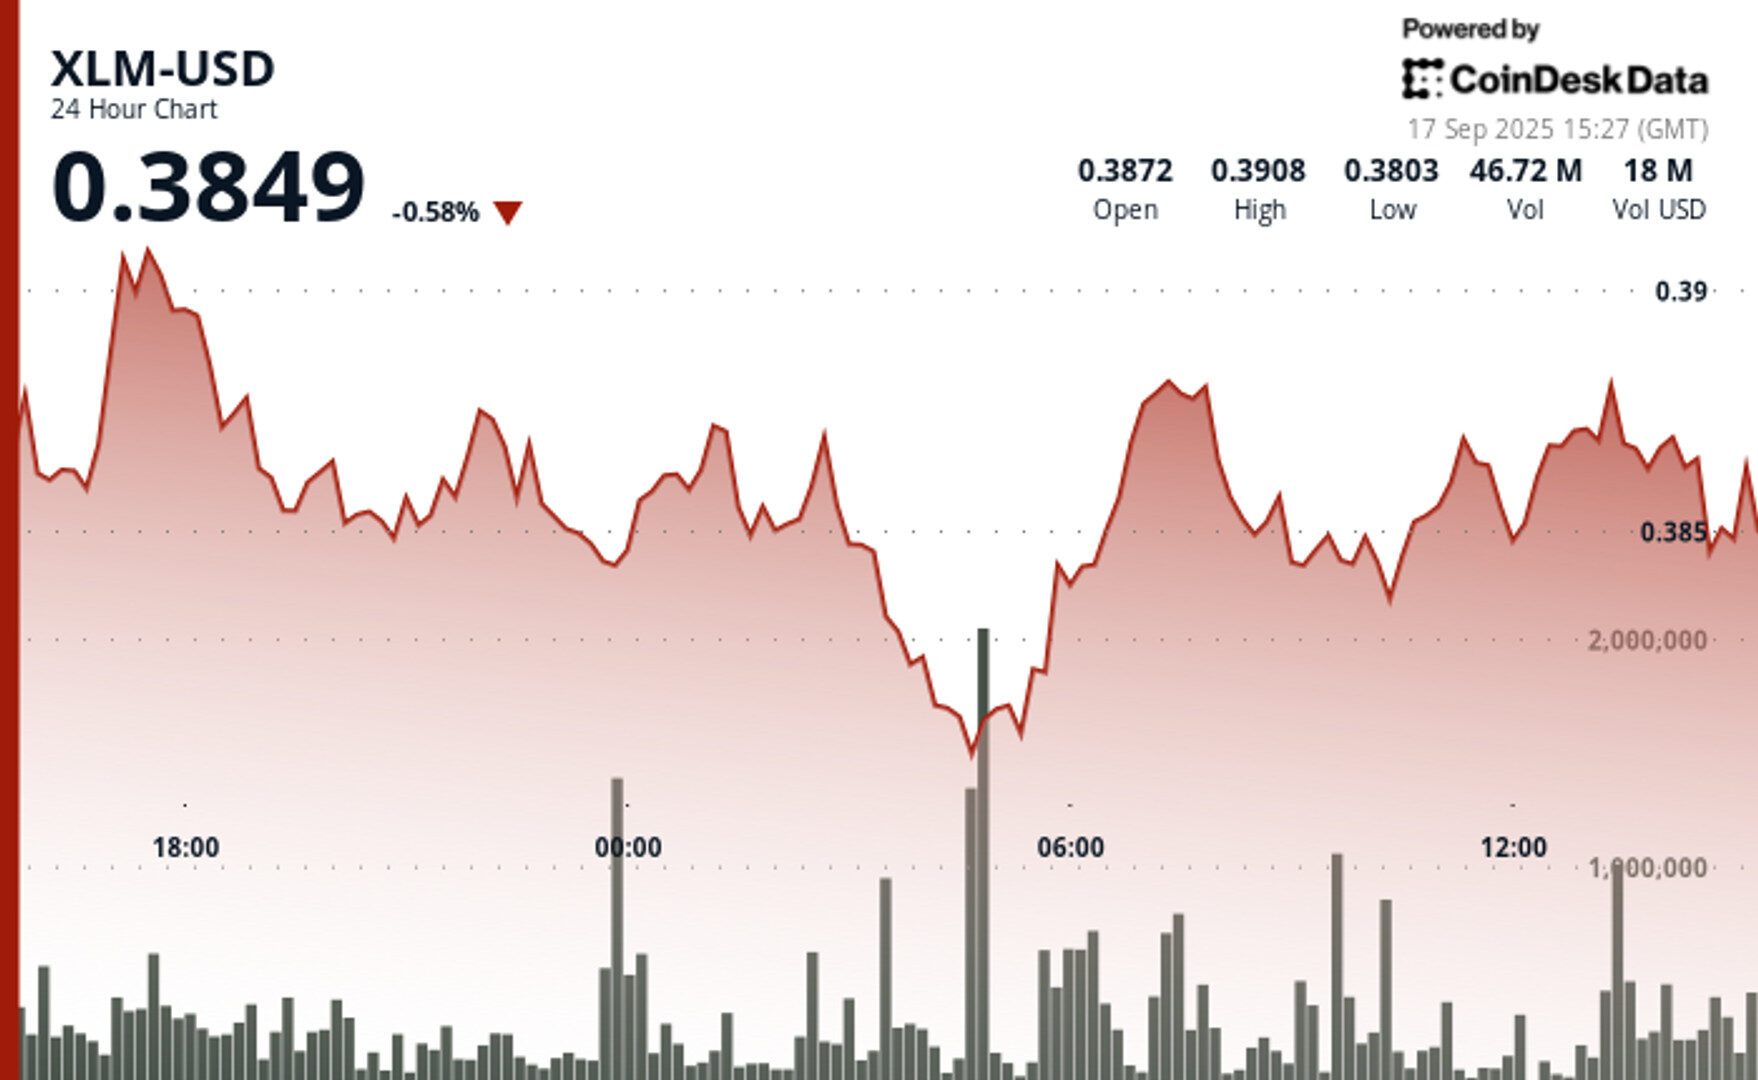
XLM rebounded from overnight lows at $0.38, with strong demand at support levels and signs of institutional accumulation driving the token back above $0.39.
By CD Analytics, Oliver Knight
Sep 17, 2025, 3:34 p.m.

- XLM dipped to $0.38 during overnight trading before rebounding with heavy buying volume.
- Recovery above $0.39 during European hours suggests institutional accumulation at support levels.
- Technical structure remains intact, with ascending lows pointing to sustained bullish momentum.
XLM rebounded strongly after facing overnight selling pressure, with the token climbing back above $0.39 during European trading hours on Tuesday. The move followed a sharp dip that saw the asset fall from $0.39 at 2 a.m. UTC to $0.38 by 4 a.m., marking the session’s steepest decline. Elevated trading activity around the $0.38 level signaled strong demand, helping to establish that zone as a key support area.
The bounce gained momentum as markets in Europe opened, pushing XLM back toward $0.39. Analysts noted that the recovery suggested institutional interest, with traders likely accumulating at discounted prices. Price action during the 24-hour window from Sept. 16 at 15:00 UTC to Sept. 17 at 14:00 UTC highlighted resilience, with the asset oscillating within a narrow $0.38–$0.39 band — a 2% swing despite heightened volatility in broader crypto markets.
STORY CONTINUES BELOW
Intraday trading in the final hour of the observed period reflected this tug-of-war between bulls and bears. After briefly testing $0.39 at 13:25 UTC, XLM slipped back to its session low just 20 minutes later before regaining momentum. The recovery from the dip underscored buying conviction, with the token closing near $0.39 and preserving its bullish structure heading into the U.S. session.

- Trading parameters of $0.38 to $0.39 constitute 2 per cent volatility differential during 24-hour assessment period.
- Acute nocturnal decline from $0.39 to $0.38 marked the period’s most pronounced bearish sentiment.
- Elevated volume participation around $0.38 threshold established critical demand confluence.
- Recovery momentum accelerated throughout European trading with ascension beyond $0.39.
- Institutional accumulation confirmed at discounted levels around psychological $0.38 support.
- Succession of ascending lows through consolidative price behaviour suggests underlying bullish conviction.
- Mid-session volatility examined critical support infrastructure during one-hour trading window.
Disclaimer: Parts of this article were generated with the assistance from AI tools and reviewed by our editorial team to ensure accuracy and adherence to our standards. For more information, see CoinDesk’s full AI Policy.
More For You
By CD Analytics, Oliver Knight
1 hour ago

HBAR held steady in a narrow band between $0.23 and $0.24, with shrinking volumes and a sharp intraday swing underscoring weakening momentum and mixed trader sentiment.
What to know:
- HBAR traded in a tight 2% range between $0.23 and $0.24 over the past 23 hours, signaling consolidation with repeated rebounds at support.
- Trading volumes fell sharply, sliding from 45.7 million to 4.7 million tokens, pointing to weakening participation and fading bullish momentum.
- An intraday sell-off and recovery highlighted ongoing market uncertainty, with bearish sentiment prevailing despite signs of technical support at $0.23.


