-
Back to menu
Prices
-
Back to menu
-
Back to menu
Indices -
Back to menu
Research
-
Back to menu
Events -
Back to menu
Sponsored
-
Back to menu
Videos -
Back to menu
-
Back to menu
-
Back to menu
Webinars
Select Language
By CD Analytics, Oliver Knight
Updated Aug 27, 2025, 3:52 p.m. Published Aug 27, 2025, 3:52 p.m.

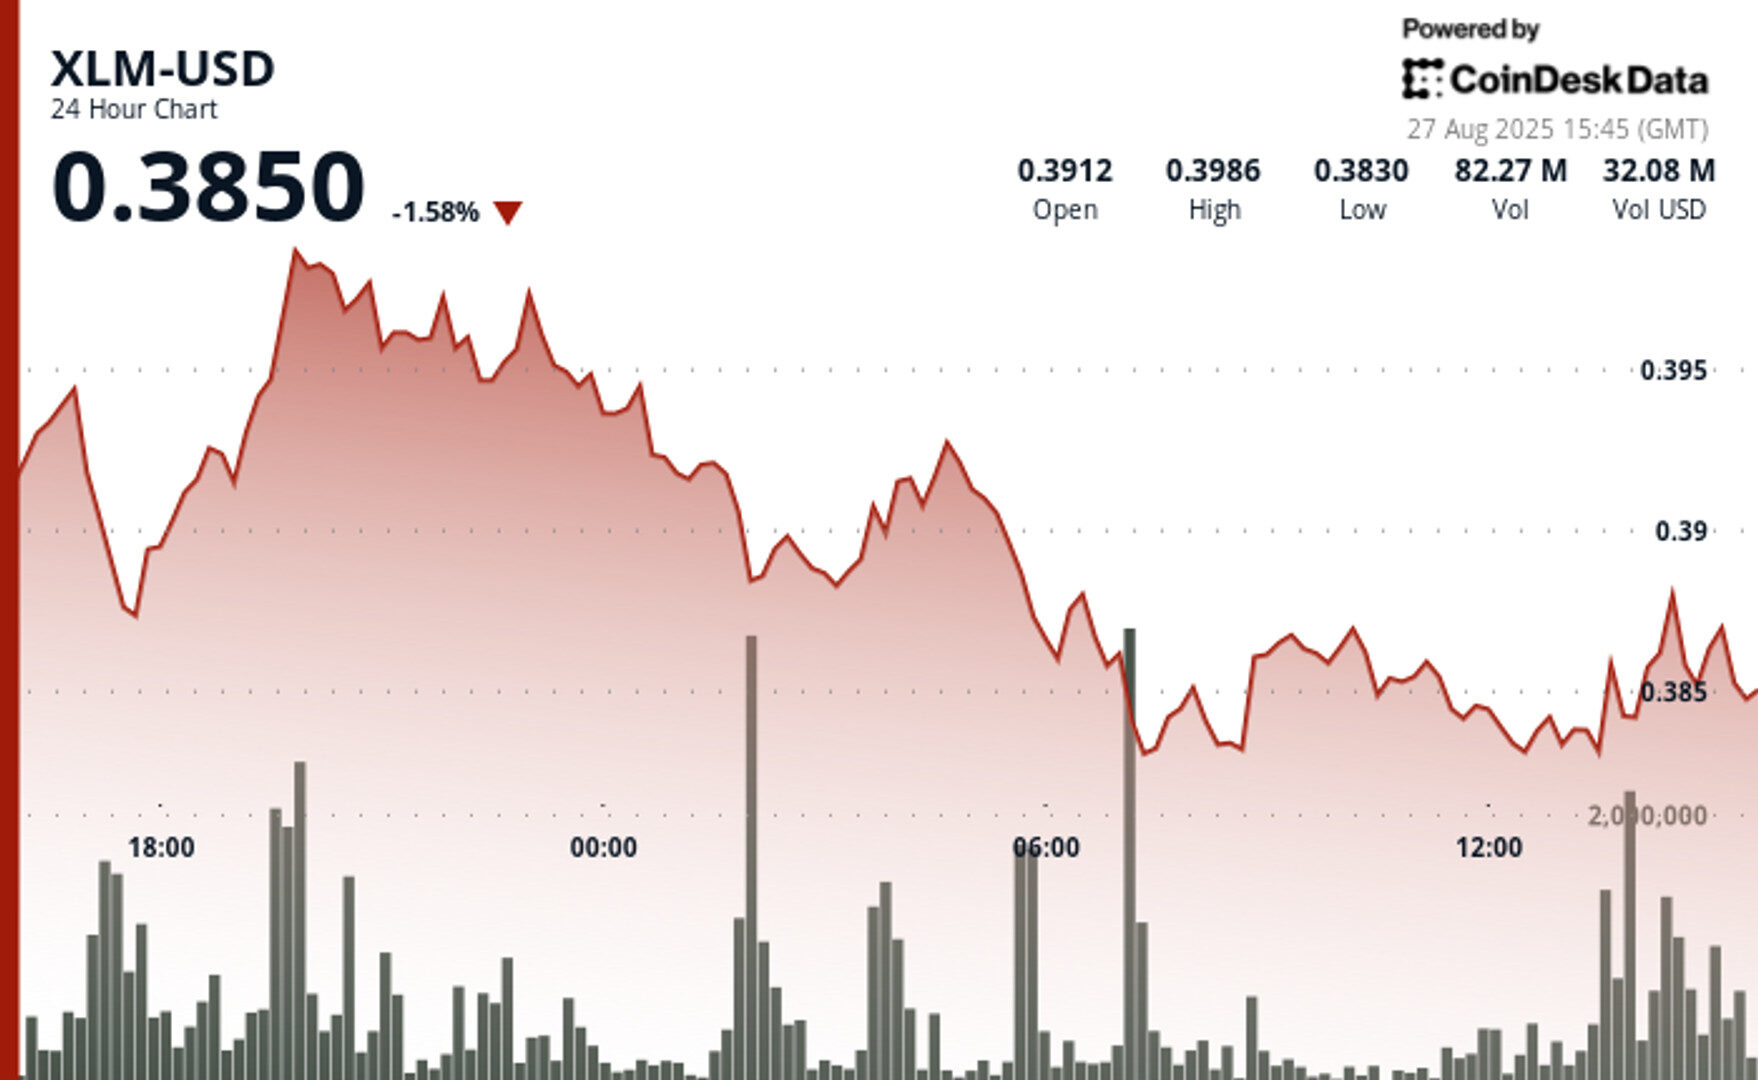
- XLM traded in a 4% band between $0.38 and $0.40, with volumes above average, pointing to sustained institutional participation despite overnight selling pressure.
- Daily turnover jumped 115% to $402.21 million, as ETF-related regulatory filings spurred increased corporate and institutional interest in Stellar and other digital assets.
- Intraday price action showed resilience, with XLM rebounding from $0.38 to $0.39 and holding support, suggesting institutional flows are shaping near-term technical levels.
Stellar’s native token, XLM, traded in a narrow but active range over the past 24 hours, reflecting broader pressures across the digital asset market. Between Aug. 26 at 15:00 and Aug. 27 at 14:00, the cryptocurrency moved within a $0.017 band – about 4% – from a high of $0.40 to a low of $0.38. After briefly testing resistance at $0.40 late on Aug. 26, XLM retraced to $0.39, a 2% dip from session openings, as sellers dominated overnight trading. Volumes ran above average at more than 45 million tokens exchanged, a sign that institutional activity remained elevated despite the pullback.
The spike in trading coincided with broader regulatory developments. Daily turnover surged 115% to $402.21 million when XLM touched $0.40, underscoring how institutional engagement has intensified alongside anticipation for possible approvals of cryptocurrency exchange-traded funds. Recent filings for funds tied to domestically developed digital assets, including Stellar, have helped draw corporate and institutional money into the space even as policymakers weigh tighter oversight.
STORY CONTINUES BELOW
Intraday action on Aug. 27 offered a snapshot of that dynamic. Between 13:20 and 14:19, XLM climbed from $0.38 to $0.39, gaining about 1% in under an hour before consolidating. Volumes peaked at 1.42 million tokens per minute during the move, setting technical resistance at $0.39 and establishing support near $0.38. The ability to hold above support in the face of profit-taking highlights that institutional flows are continuing to shape short-term market structure.

- Overall trading parameters showed a $0.017 range representing 4% spread between maximum $0.40 and minimum $0.38 levels.
- Initial price appreciation from $0.39 to $0.40 was supported by elevated trading volume of 41.02 million units.
- Strong resistance emerged at the $0.40 level, triggering subsequent selling pressure from institutional participants.
- Extended decline occurred with systematic price reduction to closing levels of $0.39.
- Sustained selling activity during early morning hours featured volume exceeding the 45.67 million unit average.
- Concentrated 60-minute period demonstrated price movement from $0.38 to $0.39 peak levels.
- Breakout pattern at 13:30 featured substantial volume of 1.42 million units.
- New resistance established at $0.39 with technical support identified around $0.38.
- Final consolidation phase indicates potential continued institutional interest.
Disclaimer: Parts of this article were generated with the assistance from AI tools and reviewed by our editorial team to ensure accuracy and adherence to our standards. For more information, see CoinDesk’s full AI Policy.
CoinDesk Analytics is CoinDesk’s AI-powered tool that, with the help of human reporters, generates market data analysis, price movement reports, and financial content focused on cryptocurrency and blockchain markets.
All content produced by CoinDesk Analytics is undergoes human editing by CoinDesk’s editorial team before publication. The tool synthesizes market data and information from CoinDesk Data and other sources to create timely market reports, with all external sources clearly attributed within each article.
CoinDesk Analytics operates under CoinDesk’s AI content guidelines, which prioritize accuracy, transparency, and editorial oversight. Learn more about CoinDesk’s approach to AI-generated content in our AI policy.

Oliver Knight is the co-leader of CoinDesk data tokens and data team. Before joining CoinDesk in 2022 Oliver spent three years as the chief reporter at Coin Rivet. He first started investing in bitcoin in 2013 and spent a period of his career working at a market making firm in the UK. He does not currently have any crypto holdings.

More For You
By CD Analytics, Oliver Knight
54 minutes ago

The Hedera token traded within a narrow $0.01 corridor, showing strong technical support and heavy volume.
What to know:
- HBAR traded in a tight $0.01 corridor ($0.24–$0.25) over a 23-hour period, with volume surging to 70.13 million units, well above session averages.
- The token briefly peaked at $0.25 on Aug. 26 before consolidating near $0.24, where multiple support tests confirmed a strong technical base.
- Institutional interest is mounting, with SWIFT testing Hedera for tokenized settlement and Grayscale establishing a Delaware trust for HBAR.


