XLM News: Token Slips 0.2% to $0.2944 as Traders Exhibit Uncertainty
-
News
-
Video
-
Consensus 2026
-
Data & Indices
XLM trades within tight $0.2810-$0.2950 corridor following volume surge that triggered key support breakdown earlier in session.
By CD Analytics, Oliver Knight
Updated Nov 12, 2025, 5:31 p.m. Published Nov 12, 2025, 5:31 p.m.

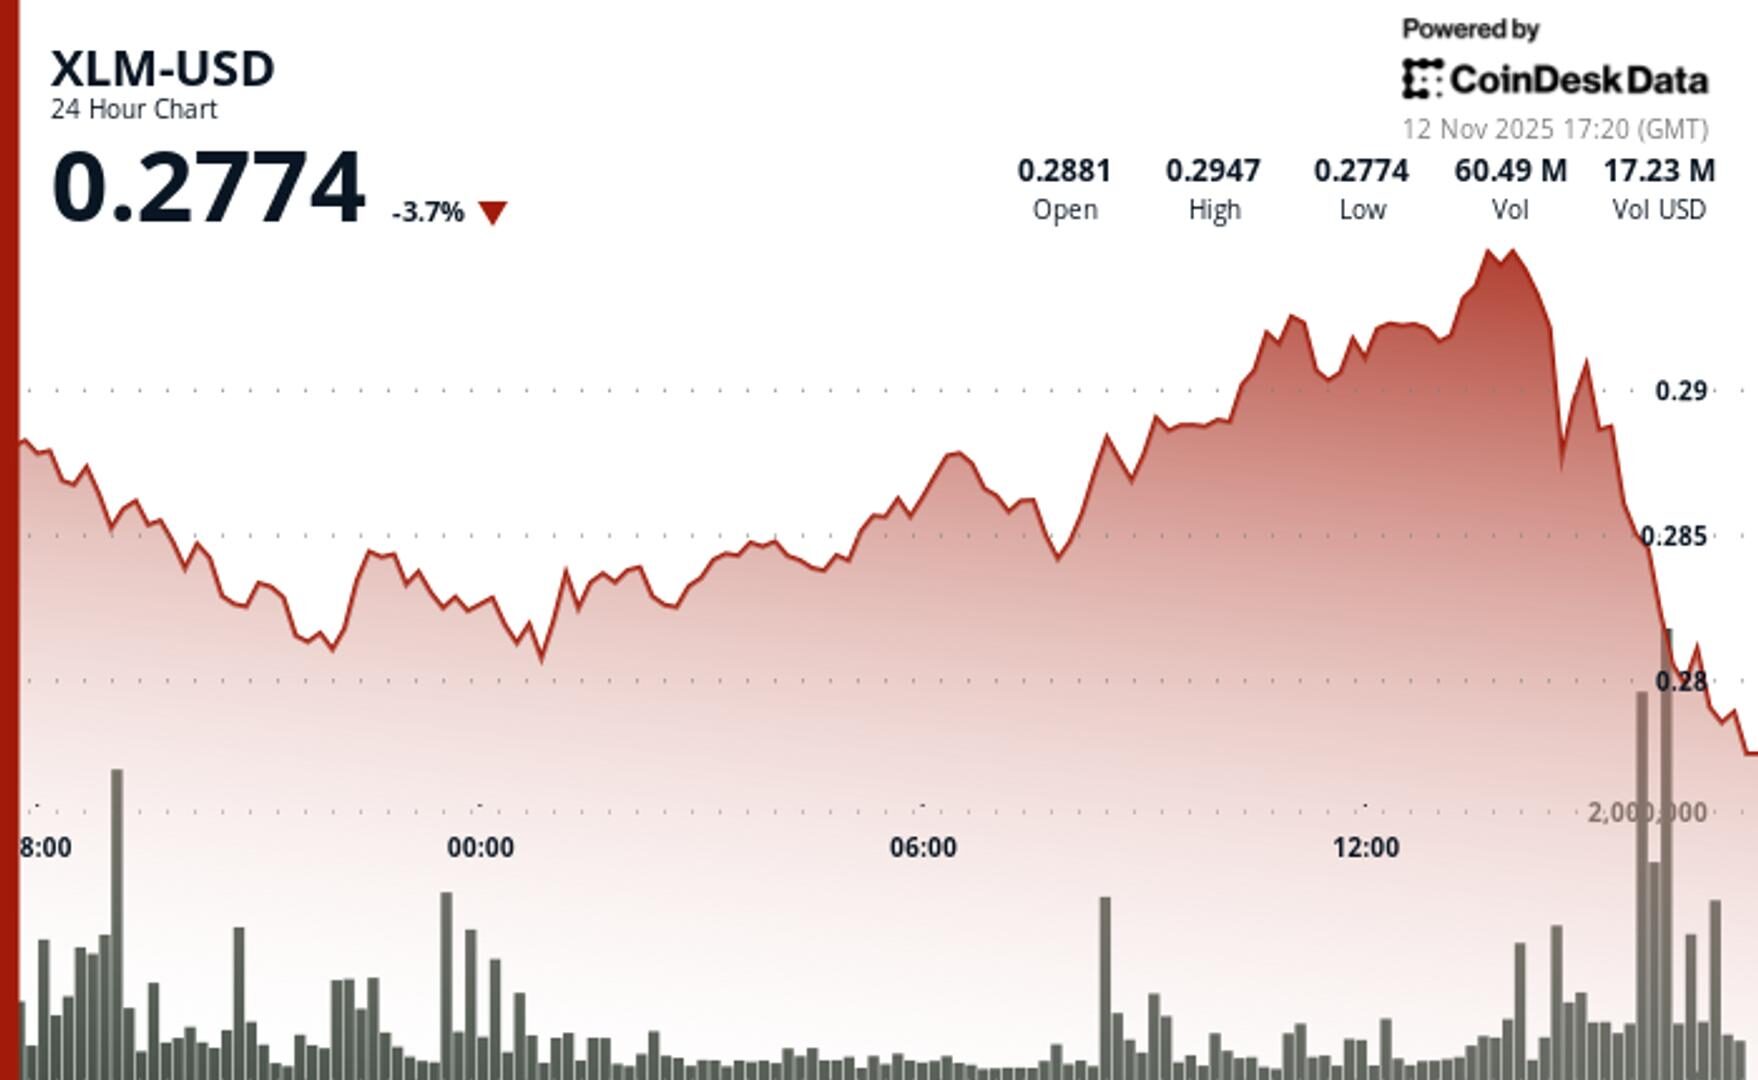
- XLM dropped from $0.2949 to $0.2944 across 24 hours in 5.0% trading range.
- Heavy selling at 11 November 20:00 smashed $0.2845 support on 36.08 million volume spike.
- Latest 60-minute data shows bullish reversal reclaiming $0.2950 resistance level.
Stellar’s performance was muted in Tuesday’s session ending Nov. 12 at 14:00 UTC, with XLM easing from $0.2949 to $0.2944 as traders settled into a tight consolidation range.
The token’s modest $0.0148 movement—around 5% of total activity—highlighted uncertainty among market participants, suggesting a lack of directional conviction.
STORY CONTINUES BELOW
A wave of heavy selling hit late on Nov. 11, with volume surging to 36.08 million tokens—47% above the 24-hour average—forcing a break below key support at $0.2845. The sell-off pushed XLM to lows near $0.2810 before buyers stepped in to stabilize prices.
With few Stellar-specific catalysts at play, traders are focusing on technical levels. Accumulation near the $0.2949 zone and increased volume suggest institutional players may be positioning for a move toward the next resistance cluster at $0.2960–$0.2970. The key question is whether the base around $0.2810 can hold firm to support a sustained push higher.

Support/Resistance:
- Primary floor established at $0.2810 after volume-driven breakdown.
- Key $0.2950 resistance reclaimed on latest 60-minute breakout pattern.
- Next upside target zone positioned at $0.2960-$0.2970 cluster.
Volume Analysis:
- Massive 36.08M volume spike (47% above SMA) marked support failure.
- Volume surge during $0.2949 retest signals institutional accumulation phase.
- Normalized activity in final hours confirms consolidation completion.
Chart Patterns:
- Initial descending trendline from session high created bearish setup.
- Tight $0.2810-$0.2950 range suggests base building structure.
- Higher highs/higher lows sequence emerges on 60-minute timeframe.
Targets & Risk/Reward:
- Immediate bullish target: $0.2960-$0.2970 resistance zone.
- Critical support defense: $0.2810 base formation low.
- Risk/reward tilts bullish above $0.2917 breakout trigger.
Disclaimer
Parts of this article were generated with the assistance from AI tools and reviewed by our editorial team to ensure accuracy and adherence to our standards. For more information, see CoinDesk’s full AI Policy.
Más para ti
16 oct 2025

Stablecoin payment volumes have grown to $19.4B year-to-date in 2025. OwlTing aims to capture this market by developing payment infrastructure that processes transactions in seconds for fractions of a cent.
Más para ti
Por CD Analytics, Siamak Masnavi
hace 15 minutos

Institutional inflows of $336 million fail to offset selling pressure as SOL falls to $153 amid fresh token releases.
Lo que debes saber:
- SOL dropped 4.9% to $153.49 despite recording $336 million in weekly ETF inflows.
- Alameda Research unlocked another 193,000 SOL tokens valued at approximately $30 million.
- Technical breakdown below $156 support accelerates selling toward $152.80 demand zone.


-
Back to menu
Prices
-
Back to menu
-
Back to menu
Indices -
Back to menu
Research
-
Back to menu
Consensus 2026 -
Back to menu
Sponsored
-
Back to menu
Videos -
Back to menu
-
Back to menu
-
Back to menu
Webinars
Select Language